Fig. 16
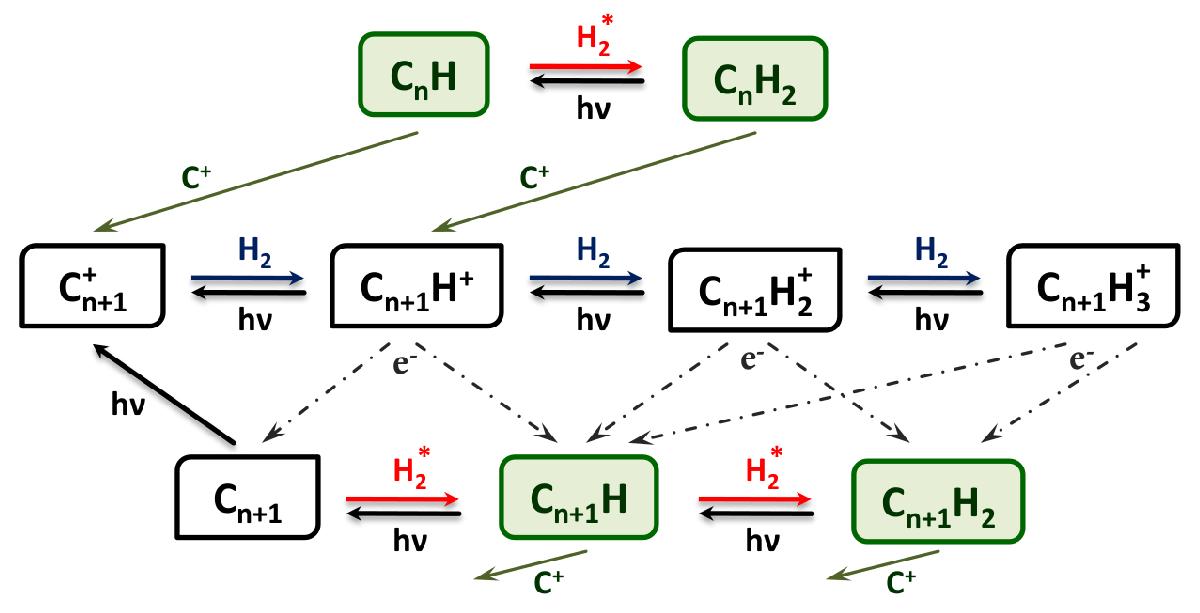
Scheme with the main gas-phase formation and destruction reactions of small hydrocarbons predicted by our model of the Orion Bar PDR at AV ≃ 1.5 (close to their abundance peak). Reactions with activation energy barriers are indicated with red arrows. The blue arrows are barrierless hydrogenation reactions.
Current usage metrics show cumulative count of Article Views (full-text article views including HTML views, PDF and ePub downloads, according to the available data) and Abstracts Views on Vision4Press platform.
Data correspond to usage on the plateform after 2015. The current usage metrics is available 48-96 hours after online publication and is updated daily on week days.
Initial download of the metrics may take a while.