Fig. 15
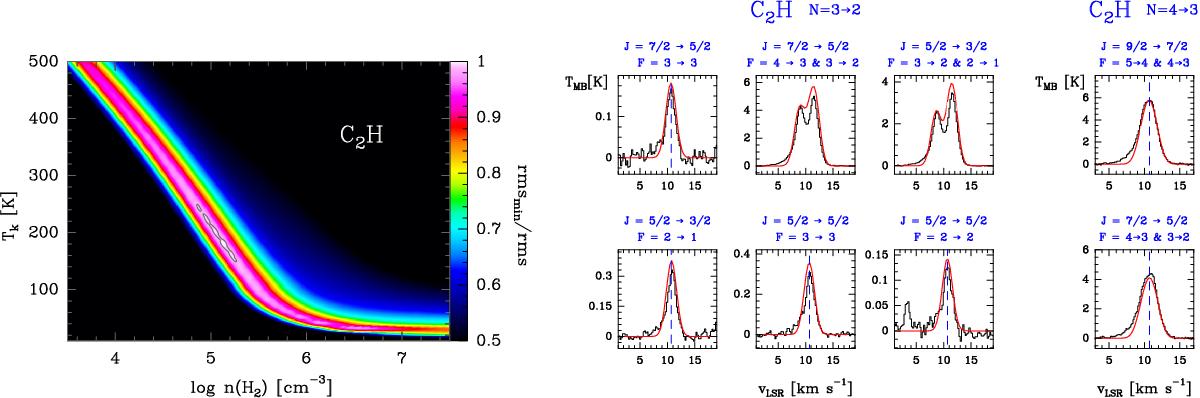
Left panel: rmsmin/rms ratio as a funtion of Tk and n(H2) for a grid of LVG models. The best fit models were obtained with Tk = 150–250 K and n(H2) = (0.7–1.7) ×105 cm-3. Right panel: observed C2H N = 3 → 2 and 4 → 3 spectra. The best fit LVG model (Tk ≃ 150 K, n(H2) ≃ 1.5 × 105 cm-3, and N(C2H) = 4.2 × 1014 cm-2) is shown overlaid in red.
Current usage metrics show cumulative count of Article Views (full-text article views including HTML views, PDF and ePub downloads, according to the available data) and Abstracts Views on Vision4Press platform.
Data correspond to usage on the plateform after 2015. The current usage metrics is available 48-96 hours after online publication and is updated daily on week days.
Initial download of the metrics may take a while.