Fig. 13
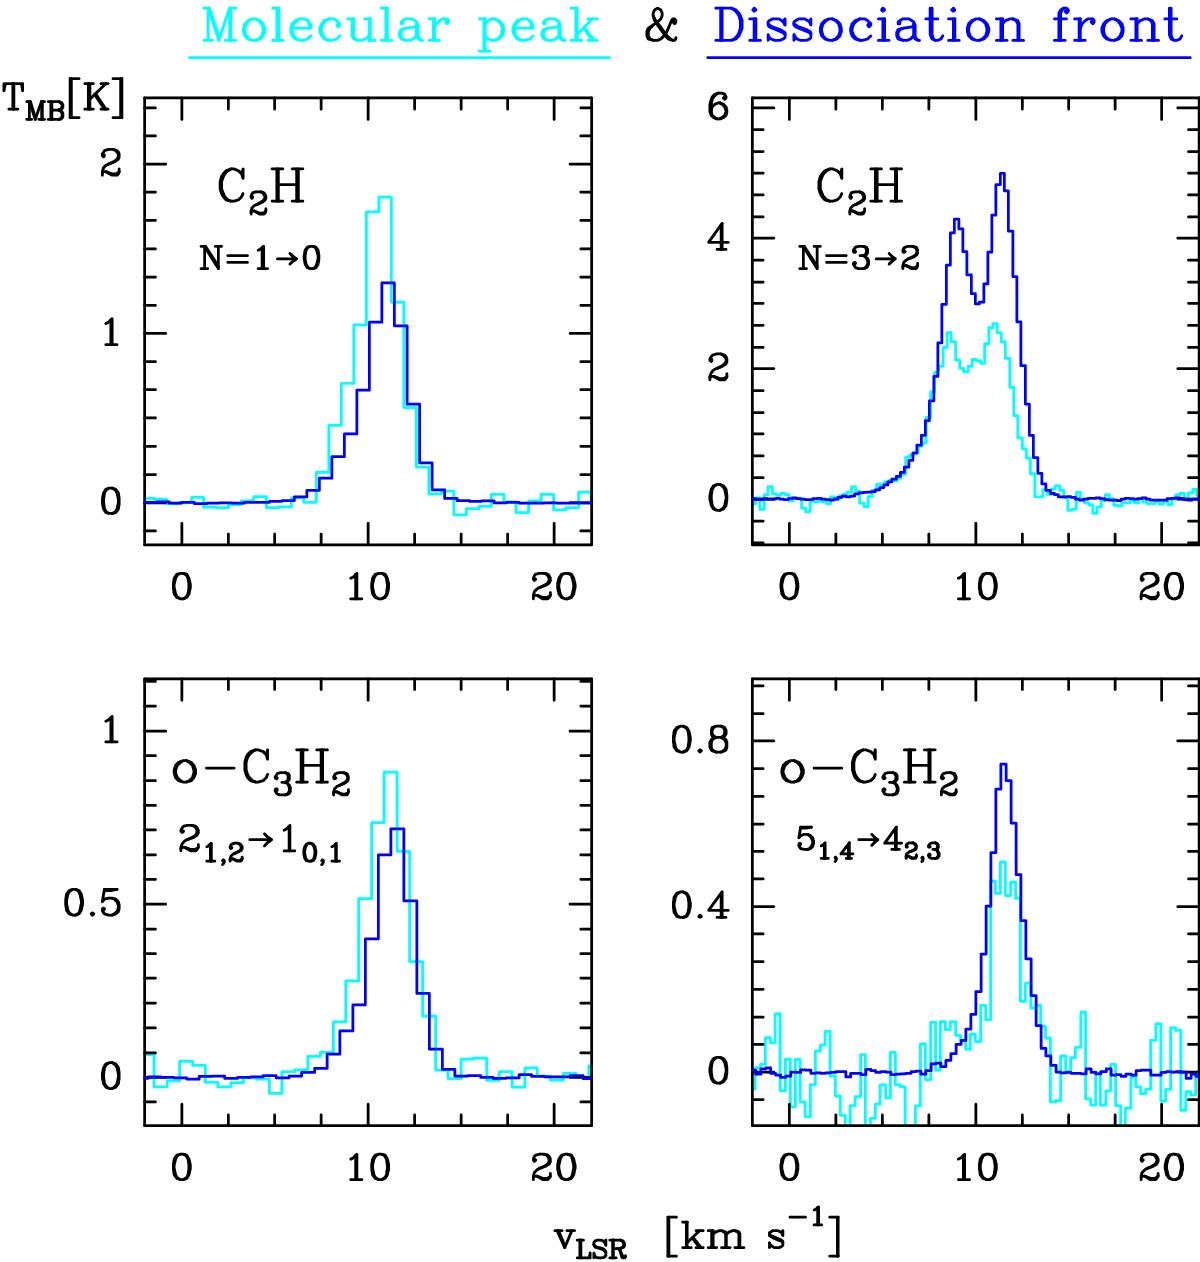
C2H (upper panels) and c-C3H2 (lower panels) spectra towards two different positions in the Orion Bar: one in the dissociation front where we have carried out a line survey (dark blue spectrum), and the other towards clump No. 10 of Lis & Schilke (2003) that we call the molecular peak (light blue spectrum). The spectra towards the molecular peak were extracted from the 1 mm and 3 mm reprojected maps.
Current usage metrics show cumulative count of Article Views (full-text article views including HTML views, PDF and ePub downloads, according to the available data) and Abstracts Views on Vision4Press platform.
Data correspond to usage on the plateform after 2015. The current usage metrics is available 48-96 hours after online publication and is updated daily on week days.
Initial download of the metrics may take a while.