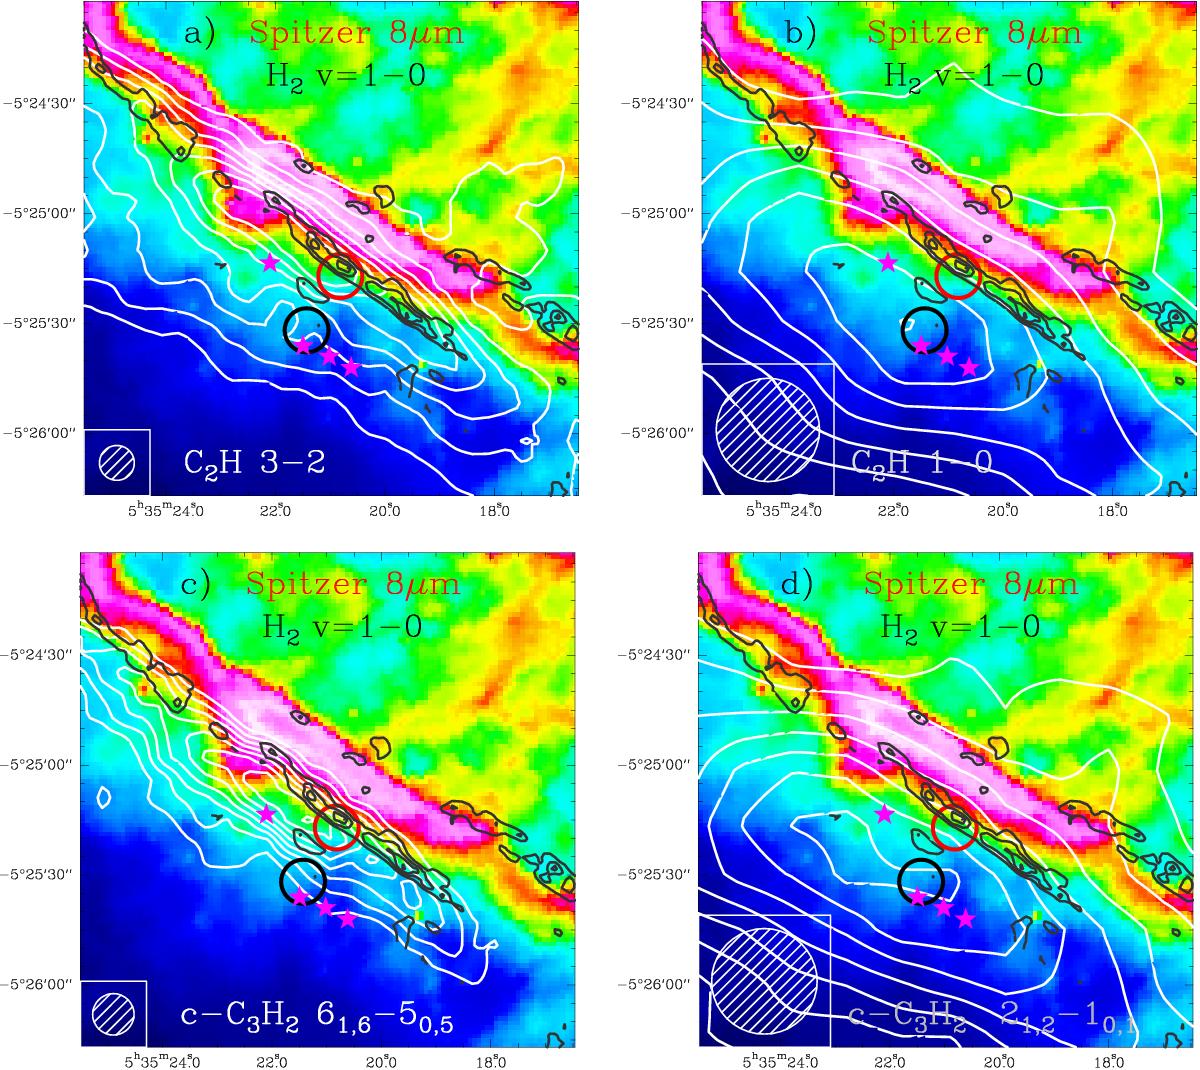
Fig. 10
C2H and
c-C3H2 integrated line-intensity maps (white contours) of
the Orion Bar. Upper panels: C2H a)
N = 3 →
2 at 262.0 GHz; and b)N = 1 → 0 at 87.3 GHz.
Lower panels: c-C3H2c) 61,6 → 50,5 at
217.8 GHz; and d) 21,2 → 10,1 at 85.3 GHz. The
Spitzer 8 μm extended emission due to PAHs and very small
grains is in colour scale. Black contours are the
H![]() ν = 1 → 0 emission
(Walmsley et al. 2000). Stars represent the
positions of denser clumps/condensations detected in H13CN J = 1 → 0 (Lis & Schilke 2003). The IRAM 30 m beams at 1
mm and 3 mm are plotted in the bottom left corner (white striped circle). The target
position of the Orion Bar survey, close to the dissociation front, and the molecular
peak position beyond the PDR (clump No. 10 of Lis
& Schilke 2003; see text for discussion) are indicated with a red and a
black circle, respectively. The emission of all lines from C2H and c-C3H2 is integrated in the 10–12
km s-1 velocity
interval in which the Orion Bar shows prominent emission.
ν = 1 → 0 emission
(Walmsley et al. 2000). Stars represent the
positions of denser clumps/condensations detected in H13CN J = 1 → 0 (Lis & Schilke 2003). The IRAM 30 m beams at 1
mm and 3 mm are plotted in the bottom left corner (white striped circle). The target
position of the Orion Bar survey, close to the dissociation front, and the molecular
peak position beyond the PDR (clump No. 10 of Lis
& Schilke 2003; see text for discussion) are indicated with a red and a
black circle, respectively. The emission of all lines from C2H and c-C3H2 is integrated in the 10–12
km s-1 velocity
interval in which the Orion Bar shows prominent emission.

Current usage metrics show cumulative count of Article Views (full-text article views including HTML views, PDF and ePub downloads, according to the available data) and Abstracts Views on Vision4Press platform.
Data correspond to usage on the plateform after 2015. The current usage metrics is available 48-96 hours after online publication and is updated daily on week days.
Initial download of the metrics may take a while.