Fig. 8
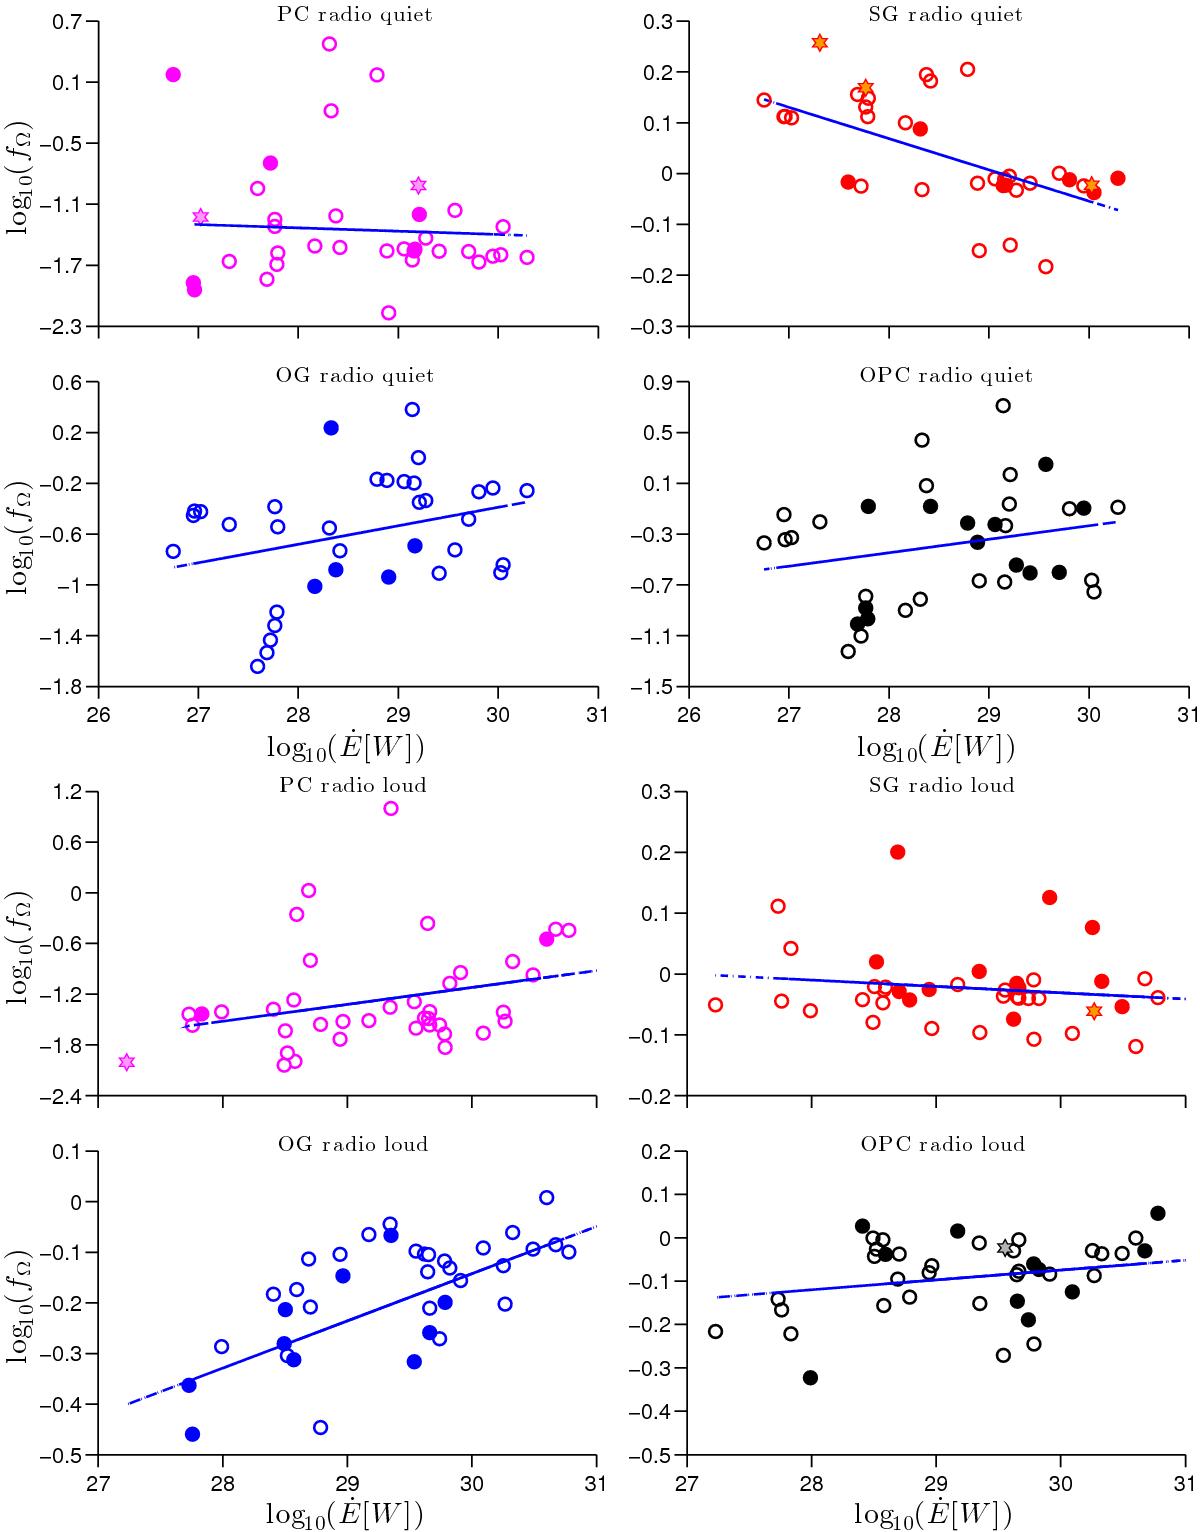
Beaming factor fΩ versus the pulsar spin-down power Ė evaluated for RQ (top panel) and RL (bottom panel) pulsars . The lines represent the best power-law fits to the data points; the best fit power-law parameters with relative 1σ errors, are listed in Table 8. Hereafter the optimum-solutions that are better than the other models by more than 1σ will be plotted as light-colour-filled hexagrams.
Current usage metrics show cumulative count of Article Views (full-text article views including HTML views, PDF and ePub downloads, according to the available data) and Abstracts Views on Vision4Press platform.
Data correspond to usage on the plateform after 2015. The current usage metrics is available 48-96 hours after online publication and is updated daily on week days.
Initial download of the metrics may take a while.