Fig. D.12
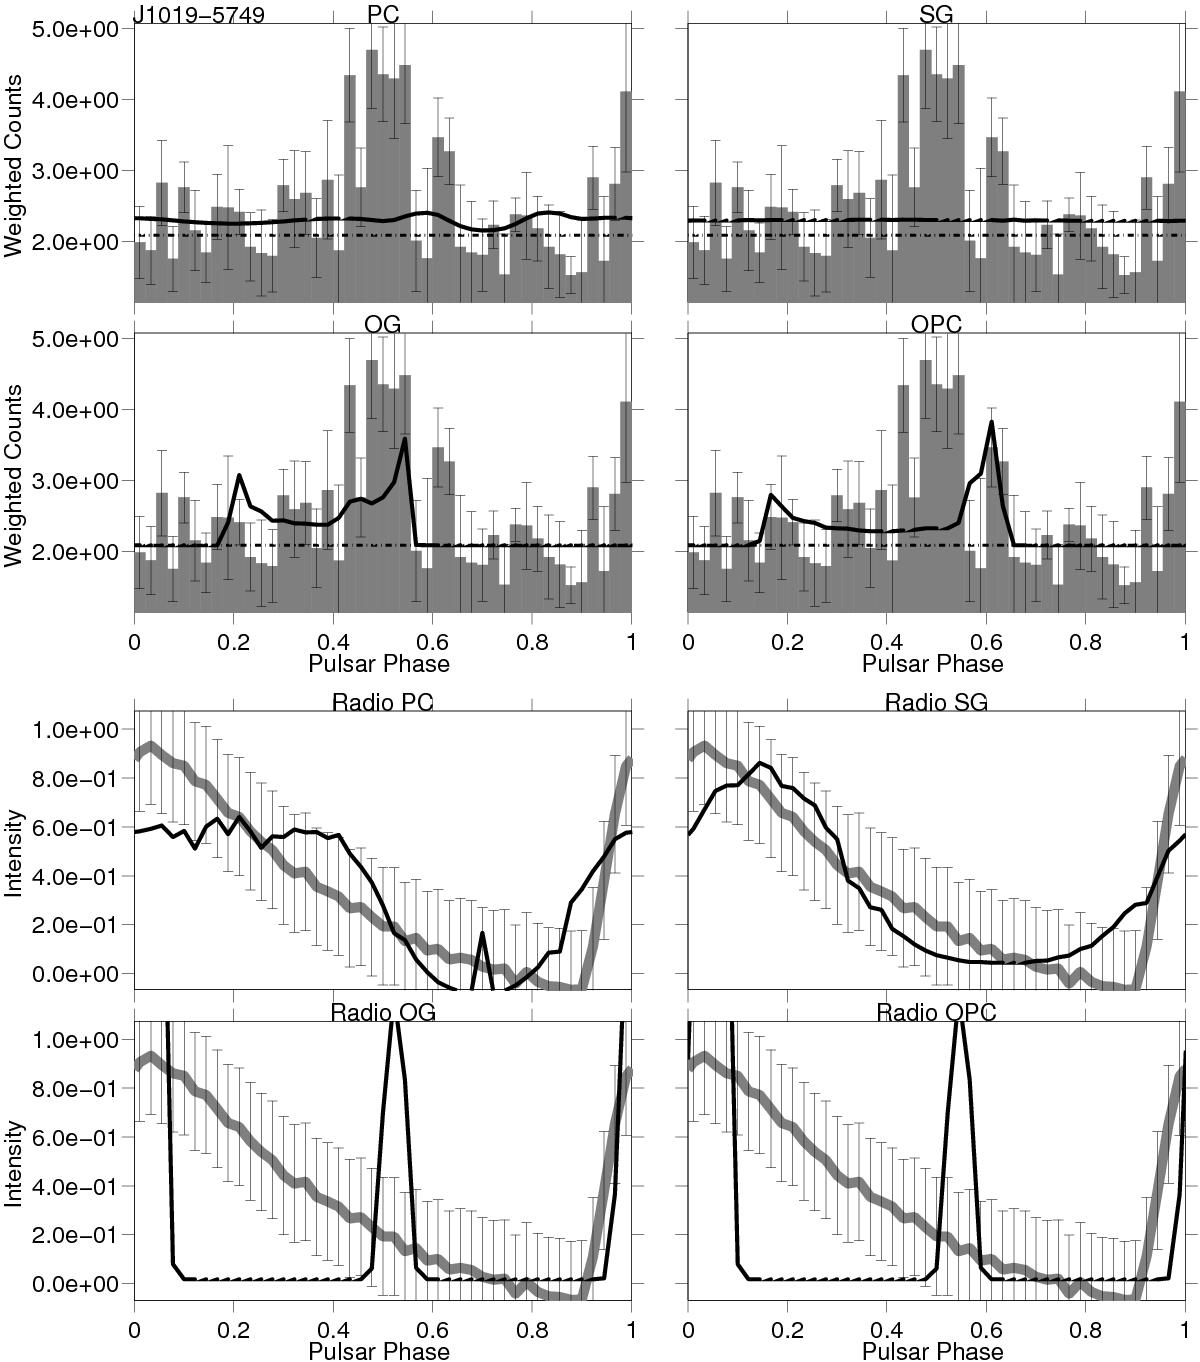
PSR J1019-5749. Top: for each model the best joint fit solution γ-ray light-curve (thick black line) is superimposed on the LAT pulsar γ-ray light-curve (shaded histogram). The estimated background is indicated by the dash-dot line. Bottom: for each model the best joint fit solution radio light-curve (black line) is superimposed on the LAT pulsar radio light-curve (grey thick line). The radio model is unique, but the (α,ζ) solutions vary for each γ-ray model. Because of the low statistics of the γ-ray light curve, the best-fit solution of each model is dominated by the radio light curve. The optimum-solution is given by the SG model but it represents an unreliable result since the best fit γ-ray light curve corresponds to a flat profile.
Current usage metrics show cumulative count of Article Views (full-text article views including HTML views, PDF and ePub downloads, according to the available data) and Abstracts Views on Vision4Press platform.
Data correspond to usage on the plateform after 2015. The current usage metrics is available 48-96 hours after online publication and is updated daily on week days.
Initial download of the metrics may take a while.