Fig. 3
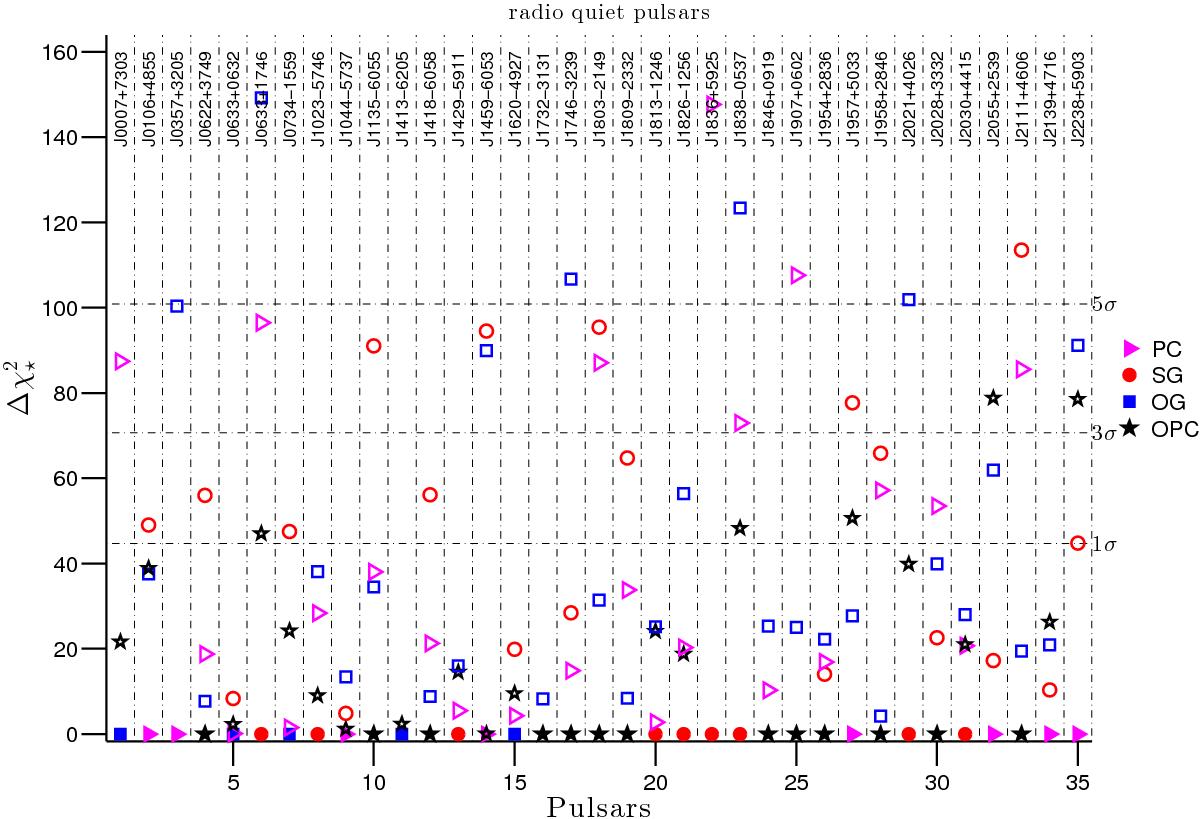
Comparison of the relative goodness of the fit solutions obtained for the RQ LAT pulsars between the optimum-model and alternative models. The comparison is expressed as the ![]() difference between the optimum and alternative model. The horizontal dash-dot lines indicate the confidence levels at which to reject a model solution compared to the optimum-solution. Triangles, circles, squares, and stars refer to the PC, SG, OG, and OPC models, respectively. Hereafter in all the figures of the paper, filled and empty symbols refer to the solutions of the optimum and alternative models, respectively.
difference between the optimum and alternative model. The horizontal dash-dot lines indicate the confidence levels at which to reject a model solution compared to the optimum-solution. Triangles, circles, squares, and stars refer to the PC, SG, OG, and OPC models, respectively. Hereafter in all the figures of the paper, filled and empty symbols refer to the solutions of the optimum and alternative models, respectively.
Current usage metrics show cumulative count of Article Views (full-text article views including HTML views, PDF and ePub downloads, according to the available data) and Abstracts Views on Vision4Press platform.
Data correspond to usage on the plateform after 2015. The current usage metrics is available 48-96 hours after online publication and is updated daily on week days.
Initial download of the metrics may take a while.