Fig. 2
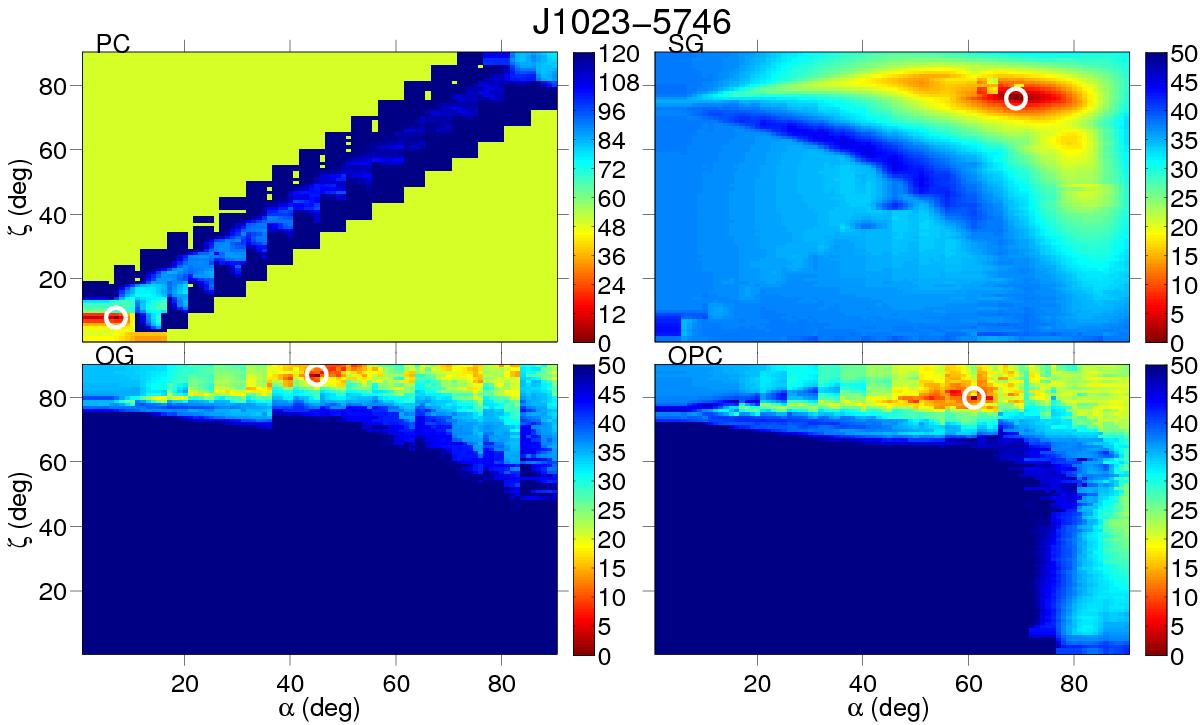
α-ζ log-likelihood maps obtained by fitting the γ-ray light curve of pulsar J1023−5746 with each γ-ray model phase plot. The fit has been performed with χ2 estimator and FCBin light curves. A white circle shows the position of the best-fit solutions. The colour-bar is in effective σ = ( | lnL − lnLmax | )0.5 units, zero corresponds to the best-fit solution. The diagonal band present in the PC panel is due to the fact that the emission region is located close to the polar cap and shines mainly when ζobs ≅ α. Elsewhere, for | ζobs − α | >ρ/ 2 with ρ the opening angle of the PC emission cone, no PC emission is visible from the pulsars and the simulated light curves for those angles are fitted as flat background emission. This generates the observed yellow flat field in the log-likelihood map.
Current usage metrics show cumulative count of Article Views (full-text article views including HTML views, PDF and ePub downloads, according to the available data) and Abstracts Views on Vision4Press platform.
Data correspond to usage on the plateform after 2015. The current usage metrics is available 48-96 hours after online publication and is updated daily on week days.
Initial download of the metrics may take a while.