Fig. 7
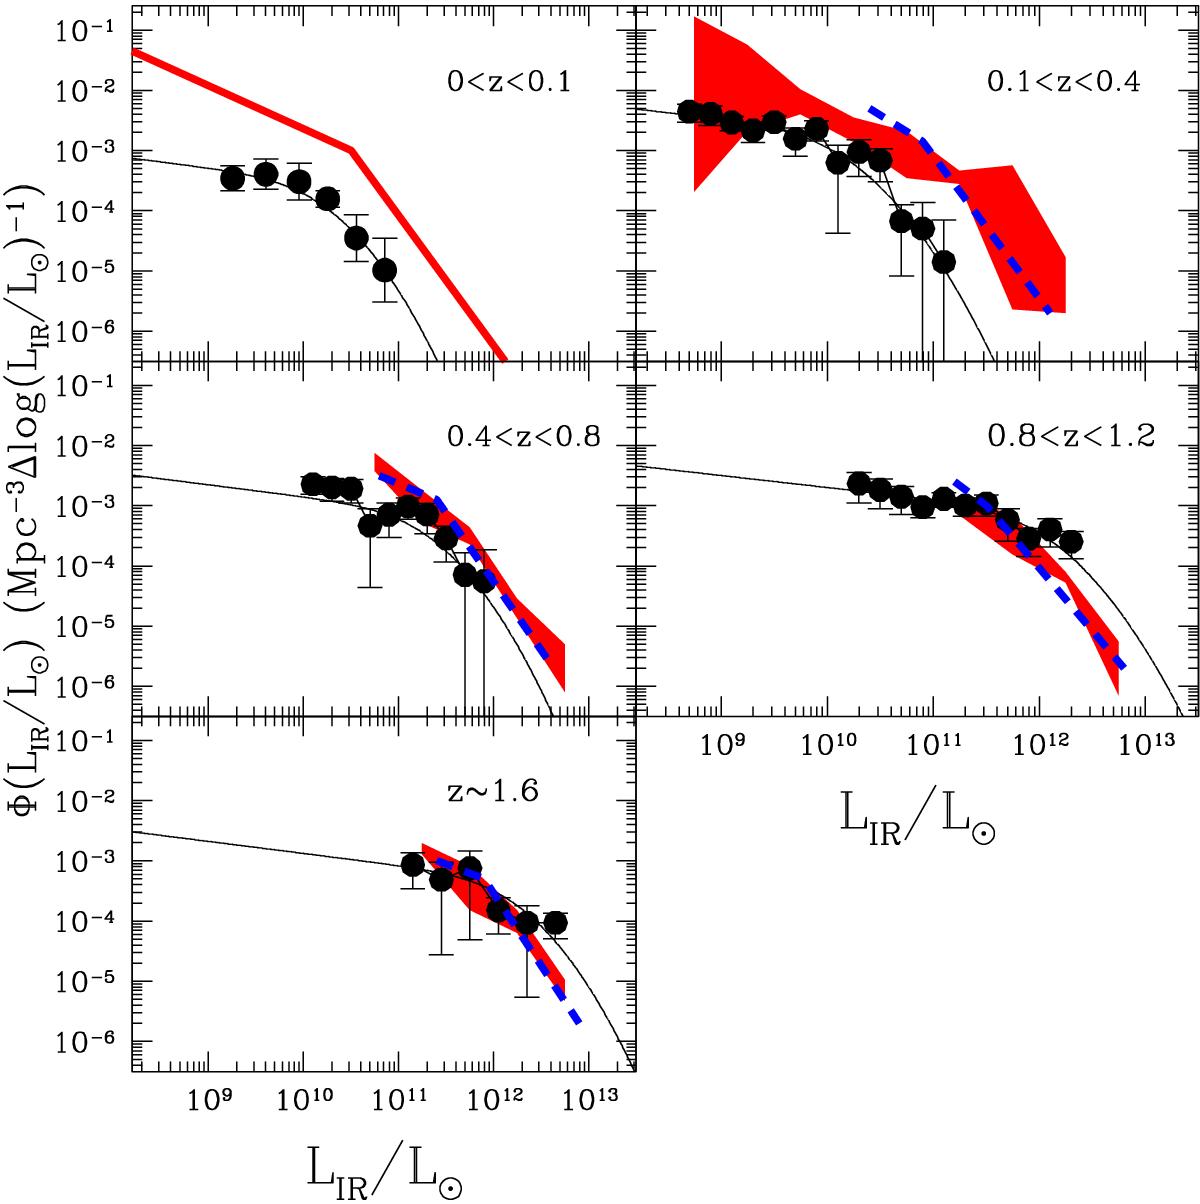
Comparison of IR LF in groups (filled points) and the total IR LF (shaded red regions). The observed IR luminosity function in galaxy groups is indicated by the points with error bars. In the first redshift bin at z< 0.1, we show the IR LF in groups derived from Guo et al. (2014) and the best fit of the field IR LF of Sanders et al. (2003). At higher redshift we use the total IR LF of Gruppioni et al. (2013, red shaded region) and Magnelli et al. (2013, blue dashed line). The IR LF in groups modified Schechter function best fit is shown by the solid line in all cases. The different luminosity limit of the group LF with respect to the total LF of Gruppioni et al. (2013) and Magnelli et al. (2013) is because the group LF is also based on MIPS 24 μm data, while the general LF is based only on PACS data.
Current usage metrics show cumulative count of Article Views (full-text article views including HTML views, PDF and ePub downloads, according to the available data) and Abstracts Views on Vision4Press platform.
Data correspond to usage on the plateform after 2015. The current usage metrics is available 48-96 hours after online publication and is updated daily on week days.
Initial download of the metrics may take a while.