Fig. 6
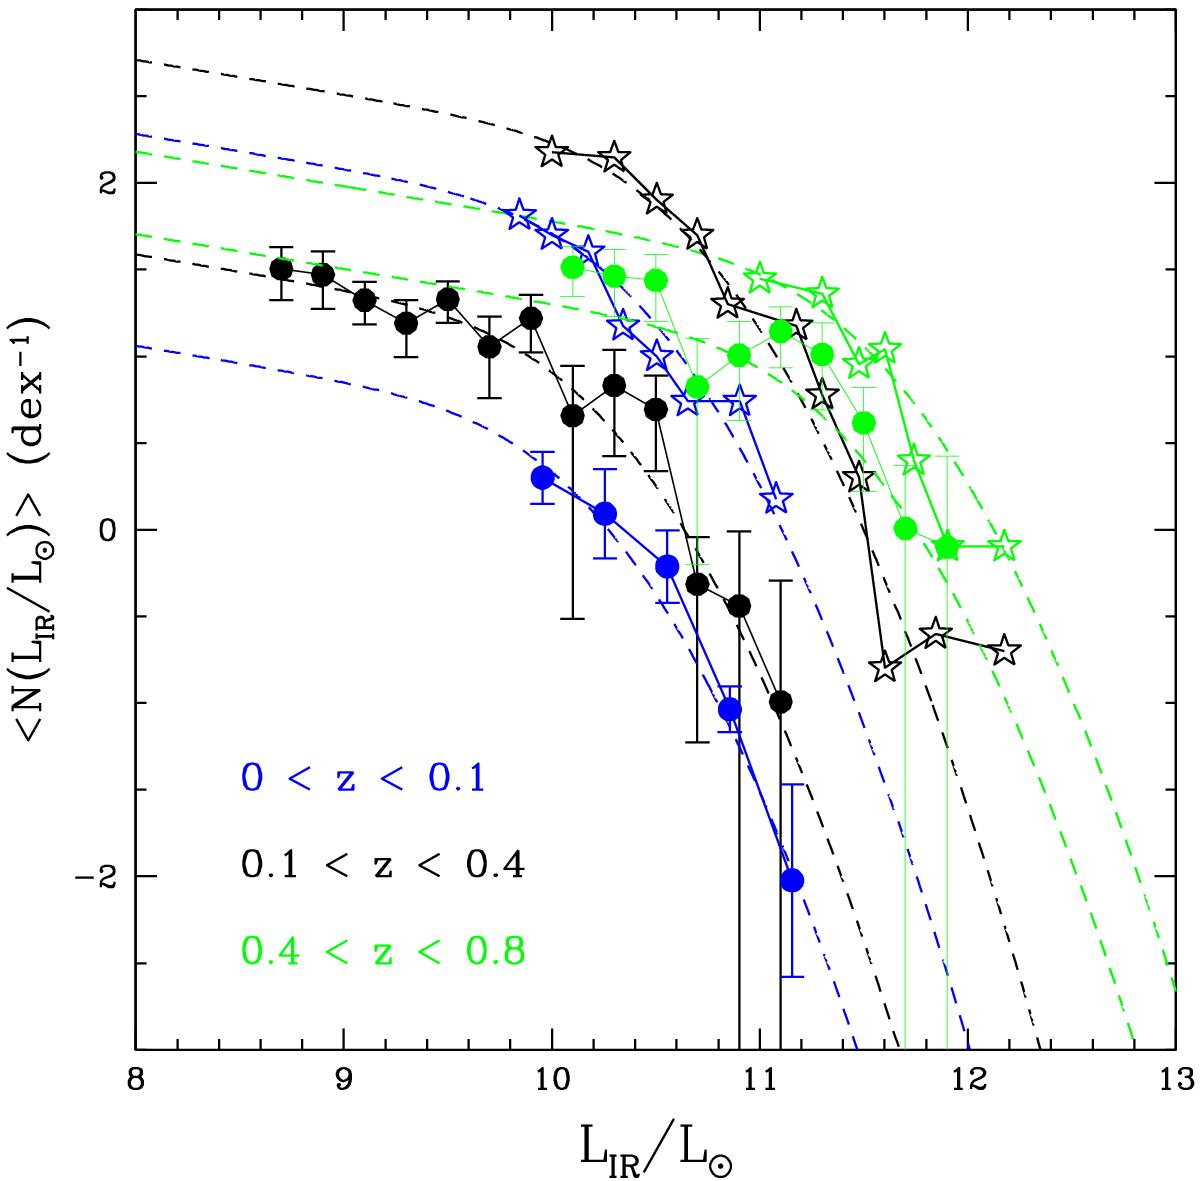
Comparison of the IR LFs in groups (filled points) with the IR LF in clusters (stars). The colour code is the same as in Fig. 4: blue for the nearby groups of Guo et al. (2014) and the Shapley superclusters (Haines et al. 2010) at z< 0.1, black for 0.1 <z< 0.4 groups and 0.15 <z< 0.3 LoCuSS clusters (Haines et al. 2013), and green for 0.4 <z< 0.8 groups and for the 0.6 <z< 0.8 rich cluster LF of Finn et al. (2010). For clarity we only show here the best fit derived with the modified Schechter function of Saunders et al. (1990).
Current usage metrics show cumulative count of Article Views (full-text article views including HTML views, PDF and ePub downloads, according to the available data) and Abstracts Views on Vision4Press platform.
Data correspond to usage on the plateform after 2015. The current usage metrics is available 48-96 hours after online publication and is updated daily on week days.
Initial download of the metrics may take a while.