Fig. 2
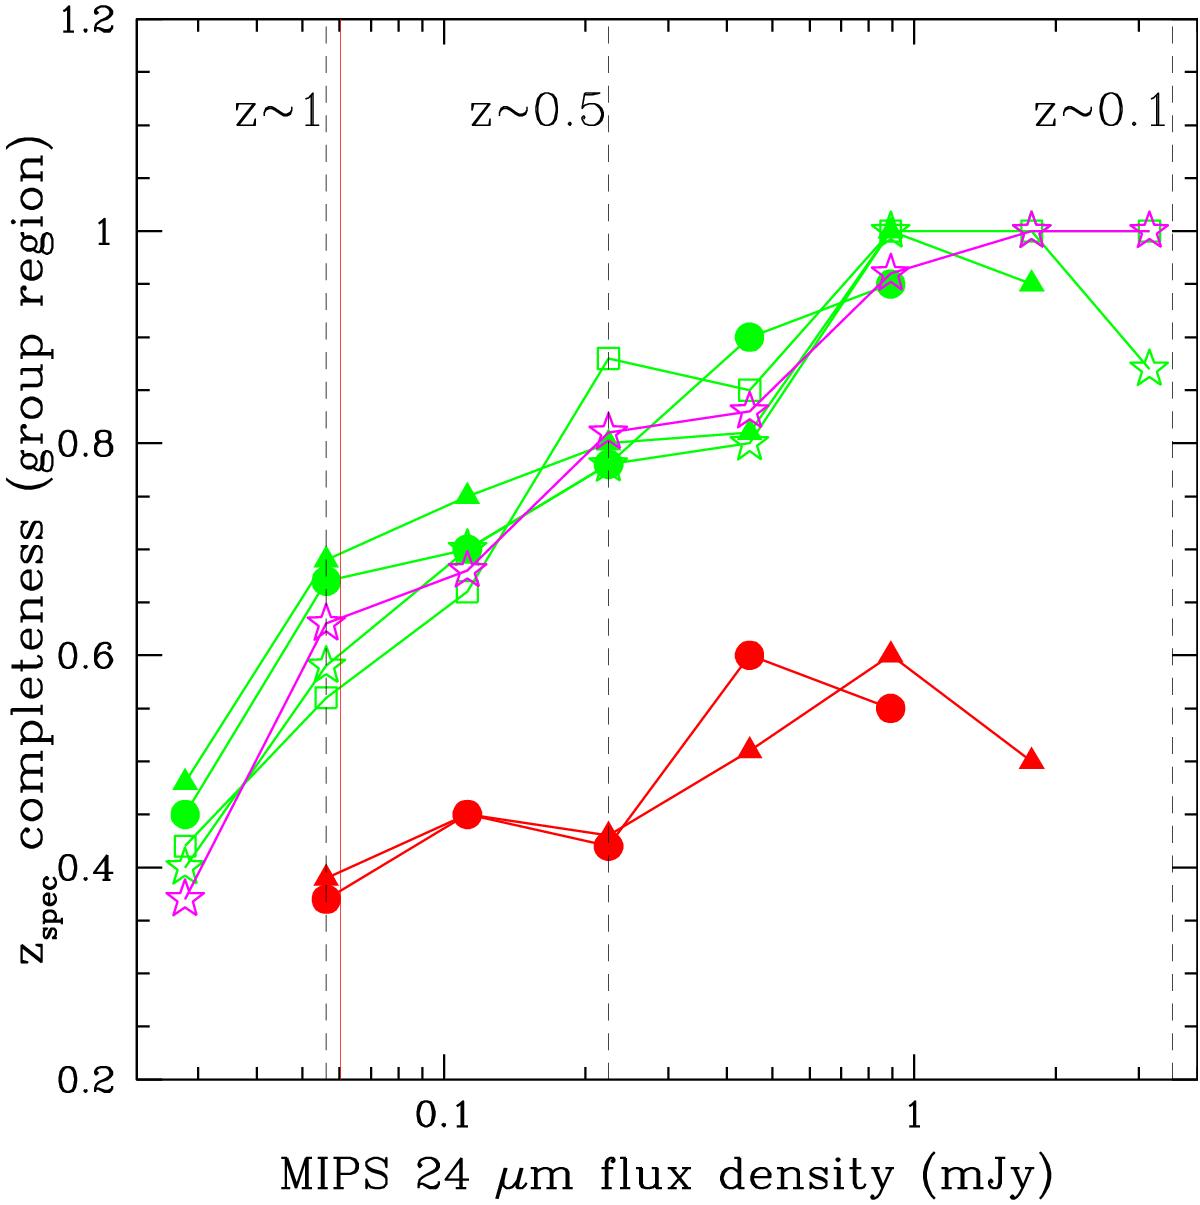
Mean spectroscopic completeness in the Spitzer MIPS 24 μm band in the group regions as a function of the redshifts. The mean completeness is estimated for groups in different redshift bins and in different fields. The green sysmbols show the mean completeness for groups in ECDFS, magenta symbols show the mean completeness for groups in GOODS-N, and red symbols show the one for the COSMOS groups. They are grouped in three redshift bins: z< 0.4 (filled circles), 0.4 <z< 0.8 (filled triangles), and 0.8 <z< 1.2 (stars). The empy squares show the completeness in the region of the Kurk et al. (2008) structure at z ~ 1.6 in ECDFS. The mean completeness of the groups in each redshift bin is estimated in the group region within an annulus of 3 × r200 from the group centre. To guide the eye, the black dashed lines in the figure show the 24 μm flux corresponding to the LIRG limit (LIR = 1011 L⊙) at low (z ~ 0.1), intermediate (z ~ 0.5), and high (z ~ 1) redshift. The solid red line shows the 60 μJy limit used to estimate the mean group completeness.
Current usage metrics show cumulative count of Article Views (full-text article views including HTML views, PDF and ePub downloads, according to the available data) and Abstracts Views on Vision4Press platform.
Data correspond to usage on the plateform after 2015. The current usage metrics is available 48-96 hours after online publication and is updated daily on week days.
Initial download of the metrics may take a while.