Fig. 9
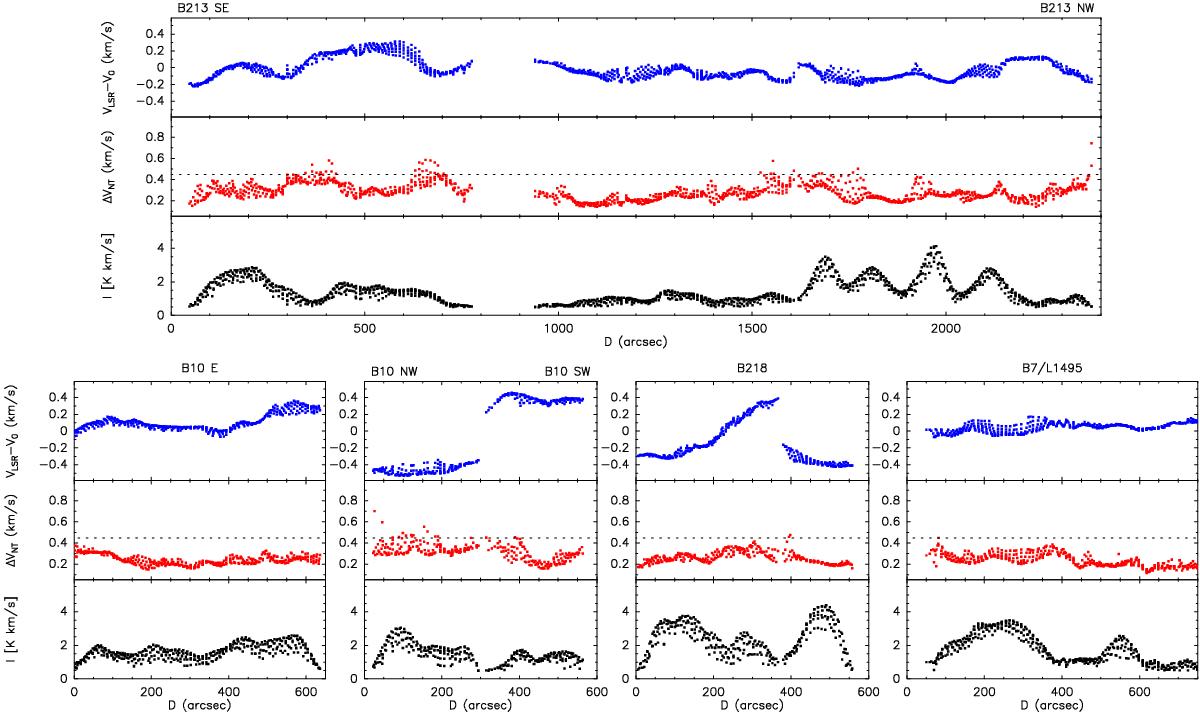
Velocity structure of the N2H+ emission along the axis of the core chains. For each chain, the plot shows the velocity centroid in the top panel (blue symbols), the non-thermal FWHM in the middle panel (red symbols), and the integrated intensity in the bottom panel (black symbols). Only points within 30′′ of the chain axis are shown to ensure proximity. The horizontal dashed line indicates the FWHM-equivalent of the sound velocity. Note the smooth oscillations in the velocity centroid and the predominance of subsonic values in the non-thermal linewidth.
Current usage metrics show cumulative count of Article Views (full-text article views including HTML views, PDF and ePub downloads, according to the available data) and Abstracts Views on Vision4Press platform.
Data correspond to usage on the plateform after 2015. The current usage metrics is available 48-96 hours after online publication and is updated daily on week days.
Initial download of the metrics may take a while.