Fig. 8
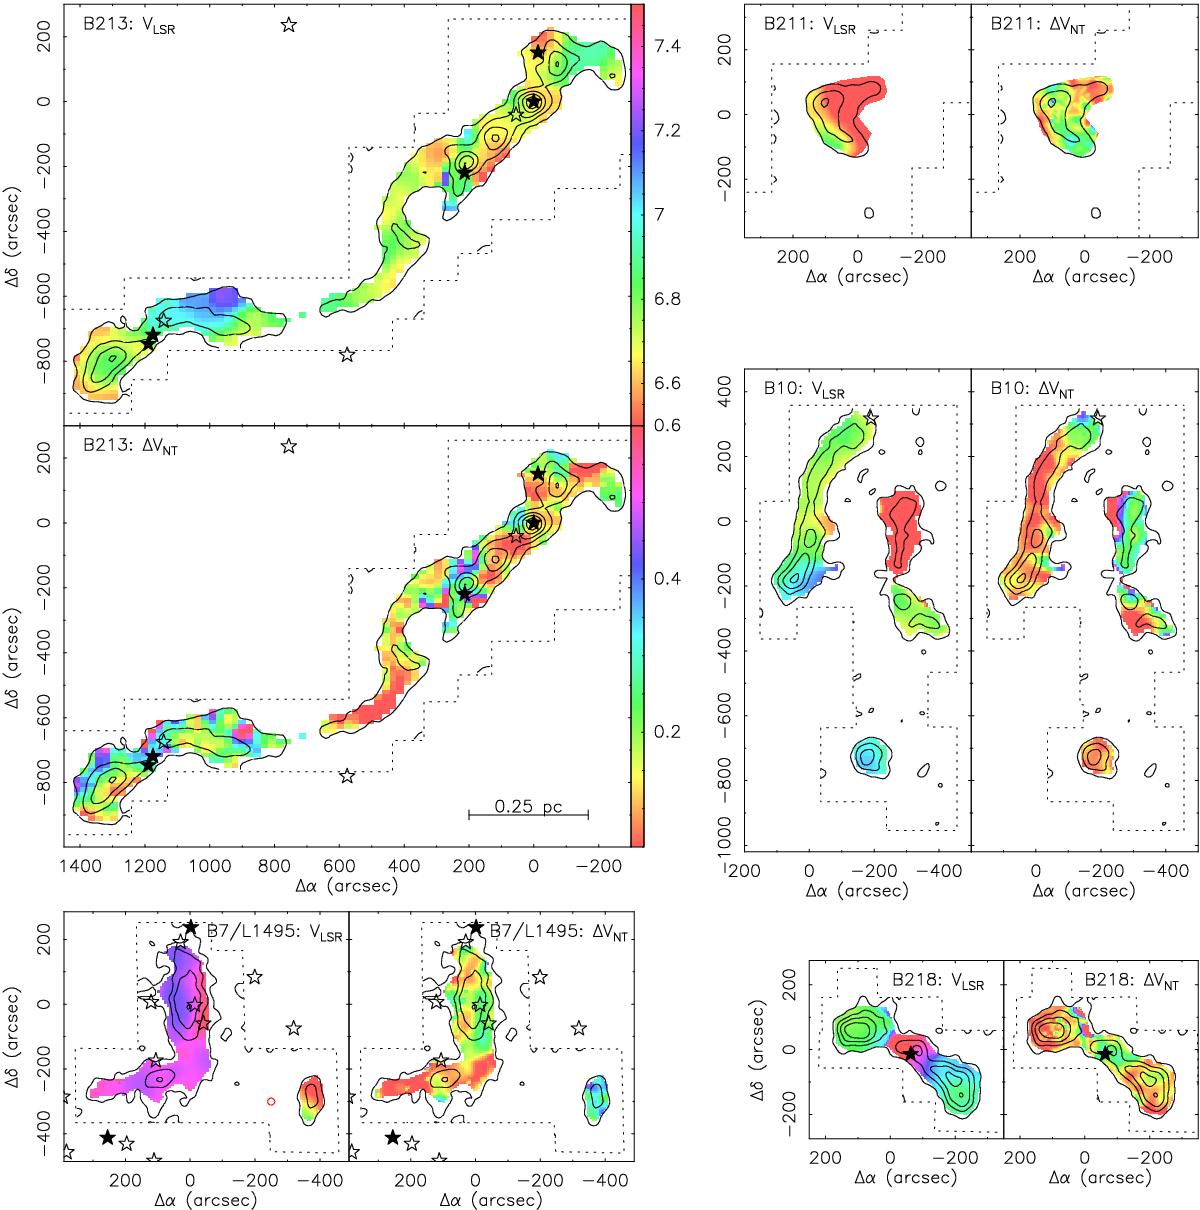
Velocity structure of the N2H+ emission as determined from hyperfine fits to the spectra. For each region, the first panel shows (in km s-1) the spatial distribution of the velocity centroid, and the second panel shows (also in km s-1) the distribution of non-thermal linewidth (FWHM). The black contours show the distribution of integrated emission to help identify the main dense gas features. All plots use the same spatial scale and color code, which is indicated by wedges in the maps of B213. Coordinate centers, contour levels, and star symbols as in Fig. 2.
Current usage metrics show cumulative count of Article Views (full-text article views including HTML views, PDF and ePub downloads, according to the available data) and Abstracts Views on Vision4Press platform.
Data correspond to usage on the plateform after 2015. The current usage metrics is available 48-96 hours after online publication and is updated daily on week days.
Initial download of the metrics may take a while.