Fig. 7
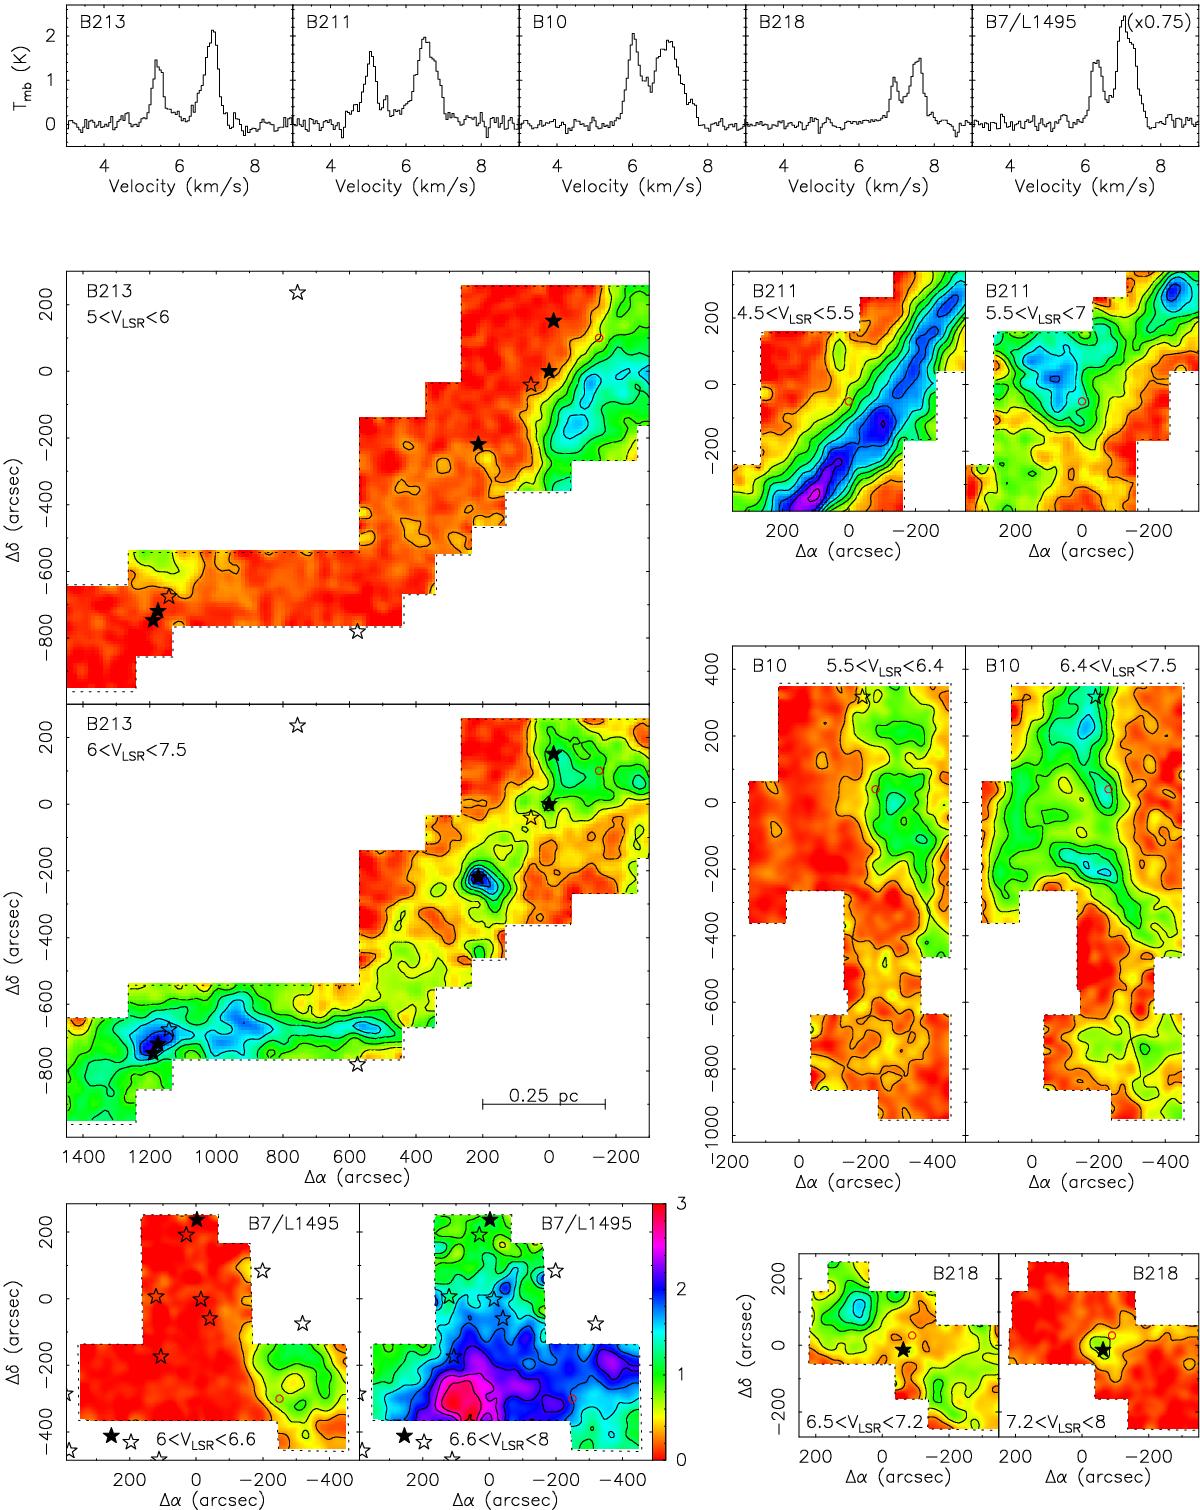
Velocity structure of the C18O(2–1) emission in L1495/B213. Top: C18O(2–1) spectra from selected positions illustrating the presence of multiple velocity components along the line of sight. The selected positions are indicated with red circles in the maps below. Bottom: maps of C18O(2–1) emission integrated in two velocity intervals that approximately coincide with the components in the top spectra. All maps have the same physical scale, color code (shown in the B7/L1495 panel), and contour scale (first contour and interval are 0.3 K km-1). Coordinate centers and star symbols as in Fig. 2.
Current usage metrics show cumulative count of Article Views (full-text article views including HTML views, PDF and ePub downloads, according to the available data) and Abstracts Views on Vision4Press platform.
Data correspond to usage on the plateform after 2015. The current usage metrics is available 48-96 hours after online publication and is updated daily on week days.
Initial download of the metrics may take a while.