Fig. 3
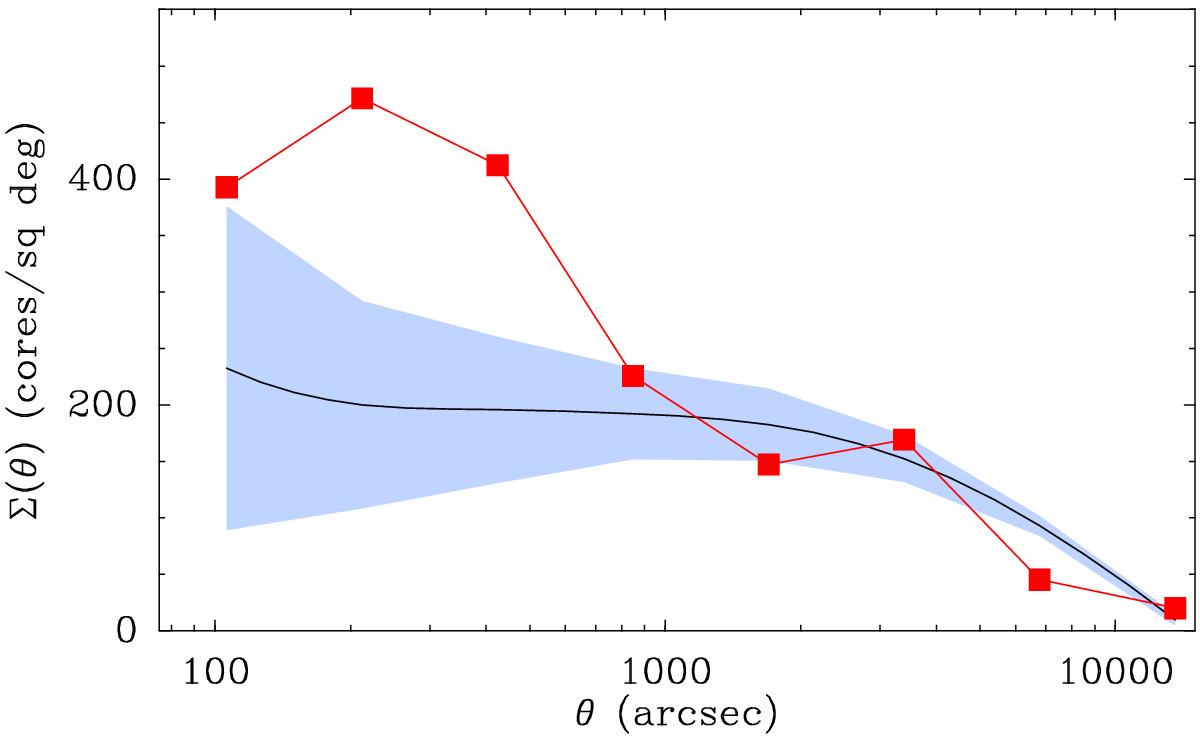
Mean surface density of companions as a function of angular separation for the 22 cores identified in L1495/B213. The red squares represent observed data. The black line and the blue-shaded region represent the mean and the ±rms interval from 100 Monte Carlo simulations of a random distribution of 22 cores. The departure of the red squares from the shaded region at small angles indicates a significant level of clustering at scales less than 700′′.
Current usage metrics show cumulative count of Article Views (full-text article views including HTML views, PDF and ePub downloads, according to the available data) and Abstracts Views on Vision4Press platform.
Data correspond to usage on the plateform after 2015. The current usage metrics is available 48-96 hours after online publication and is updated daily on week days.
Initial download of the metrics may take a while.