Fig. 2
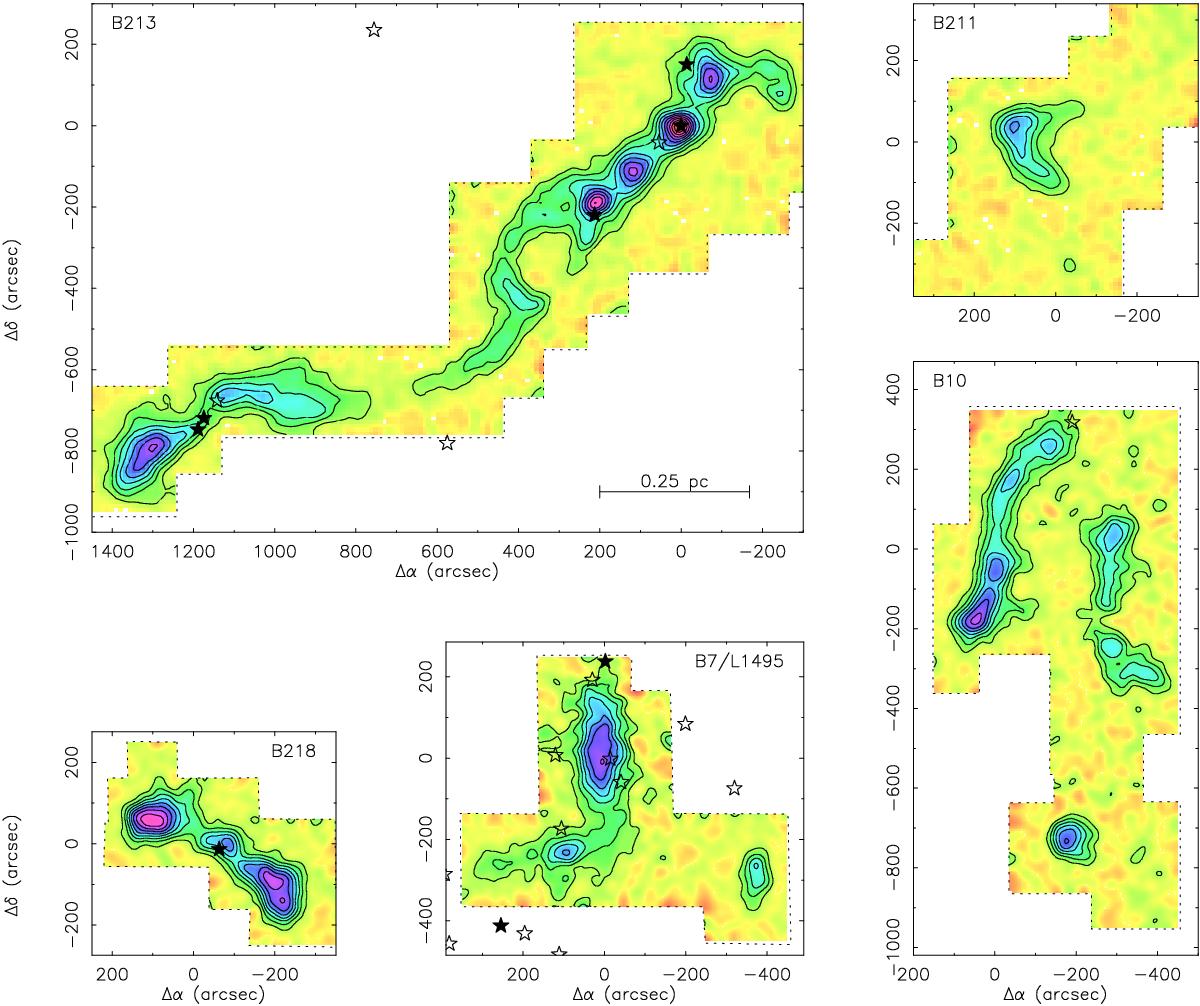
Integrated intensity maps of the N2H+(1–0) emission showing how the dense cores in L1495/B213 form linear chain-like structures (IRAM 30 m data). All maps have the same linear and intensity scales, and the first contour and contour interval are 0.5 K km s-1. The star symbols indicate the position of the YSOs in the compilation of Luhman et al. (2010), with solid symbols representing Class 0/I objects. The central positions, in (α(J2000), δ(J2000)) coordinates are (04:19:42.5, +27:13:36) for B213, (04:18:05.0, +27:35:16) for B211, (04:28:02.0, +26:19:32) for B218, (04:18:32.2, +28:27:18) for B7, and (04:18:04.0, +28:08:14) for B10.
Current usage metrics show cumulative count of Article Views (full-text article views including HTML views, PDF and ePub downloads, according to the available data) and Abstracts Views on Vision4Press platform.
Data correspond to usage on the plateform after 2015. The current usage metrics is available 48-96 hours after online publication and is updated daily on week days.
Initial download of the metrics may take a while.