Fig. 1
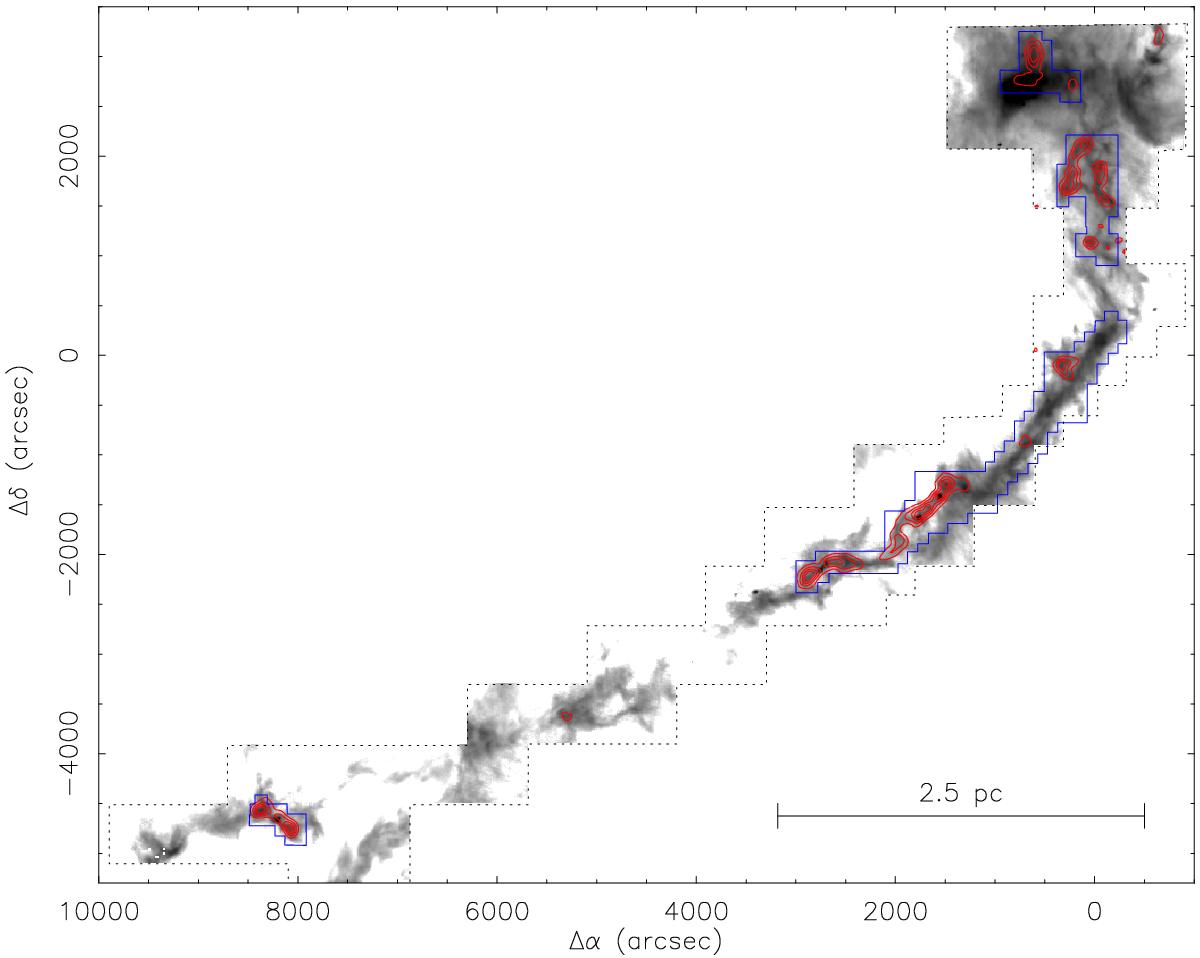
Large-scale view of the L1495/B213 complex. The grey scale shows the Herschel-SPIRE 250 μm emission mapped by Palmeirim et al. (2013), and the red contours represent the N2H+(1–0) emission mapped by Hacar et al. (2013) with the FCRAO telescope. The black dashed lines show the limits of the FCRAO observations, and the blue solid lines enclose the regions newly mapped with the IRAM 30 m telescope.
Current usage metrics show cumulative count of Article Views (full-text article views including HTML views, PDF and ePub downloads, according to the available data) and Abstracts Views on Vision4Press platform.
Data correspond to usage on the plateform after 2015. The current usage metrics is available 48-96 hours after online publication and is updated daily on week days.
Initial download of the metrics may take a while.