| Issue |
A&A
Volume 574, February 2015
|
|
|---|---|---|
| Article Number | A22 | |
| Number of page(s) | 7 | |
| Section | Planets and planetary systems | |
| DOI | https://doi.org/10.1051/0004-6361/201424256 | |
| Published online | 19 January 2015 | |
Impact induced surface heating by planetesimals on early Mars
1
Department of AstrophysicsUniversity of Vienna,
Türkenschanzstrasse 17,
1180
Wien,
Austria
e-mail:
This email address is being protected from spambots. You need JavaScript enabled to view it.
2
Space Research Institute, Austrian Academy of
Sciences, Schmiedlstrasse
6, 8042
Graz,
Austria
3
Institut für Astronomie und Astrophysik, Eberhard Karls
Universität Tübingen, Auf der
Morgenstelle 10, 72076
Tübingen,
Germany
4
Physikalisches Institut, Eberhard Karls Universität
Tübingen, Auf der Morgenstelle
14, 72076
Tübingen,
Germany
5
Institute of Physics, IGAM, University of Graz, Universitätsplatz
5, 8010
Graz,
Austria
6
Institute for Computational Modelling, Russian Academy of
Sciences, 660041
Krasnoyarsk 36, Russian
Federation
7
Siberian Federal University, 660041
Krasnoyarsk, Russian
Federation
Received: 22 May 2014
Accepted: 13 November 2014
Abstract
Aims. We investigate the influence of impacts of large planetesimals and small planetary embryos on the early Martian surface on the hydrodynamic escape of an early steam atmosphere that is exposed to the high soft X-ray and extreme-ultraviolet (EUV) flux of the young Sun.
Methods. Impact statistics in terms of number, masses, velocities, and angles of asteroid impacts onto early Mars are determined via n-body integrations. Based on these statistics, smoothed particle hydrodynamics (SPH) simulations result in estimates of energy transfer into the planetary surface material and the resulting surface heating. For the estimation of the atmospheric escape rates we applied a soft X-ray and EUV absorption model and a 1D upper atmosphere hydrodynamic model to a magma ocean-related catastrophically outgassed steam atmosphere with surface pressure values of 52 bar H2O and 11 bar CO2.
Results. The estimated impact rates and energy deposition onto an early Martian surface can account for substantial heating. The energy influx and conversion rate into internal energy is probably sufficient to keep a shallow magma ocean liquid for an extended period of time. Higher surface temperatures keep the outgassed steam atmosphere longer in vapor form and therefore enhance its escape to space within ~0.6 Myr after its formation.
Key words: planets and satellites: formation / planets and satellites: terrestrial planets / planets and satellites: atmospheres / stars: solar-type / Sun: UV radiation / celestial mechanics
© ESO, 2015
1. Introduction
Theoretical hypotheses based on geochemical observations indicate the occurrence of magma oceans or at least magma ponds during the early evolution of terrestrial planets, but also in large planetary embryos and in many early accreting planetesimals (Elkins-Tanton 2012). Impacts are a particular form of accretion. The melting during collisions between large planetesimals and planetary embryos suggests that silicate and metallic material may be processed through multiple magma oceans before a growing planet reaches solidity. Impacts and the related processes of magma ocean formation and its solidification, strongly influence the earliest compositional differentiation, volatile contents, and the origin of catastrophically outgassed H2O and carbon-rich protoatmospheres of the terrestrial planets (Elkins-Tanton 2008, 2012; Lammer 2013). In addition to impacts, large planetesimals with radii between tens and hundreds of kilometers that accreted within ≤1.5 Myr have most likely experienced significant and in many cases complete melting as a result of radiogenic heating from short-lived radioisotopes (Urey 1955; Lee et al. 1976; LaTourrette & Wasserburg 1998).
Mars most likely formed before Venus and the Earth-Moon system (Kleine et al. 2004). The latest research in planet formation reveals that Mars formed within a few Myr (Brasser 2013; Morbidelli et al. 2012). Thus, Mars can also be considered as a surviving large planetary embryo whose building blocks consisted of material that formed in orbital locations just beyond the ice line with an initial H2O inventory of ~0.1–0.2 wt-%. Erkaev et al. (2014) showed that after the solidification of Mars’ magma ocean, a catastrophically outgassed steam atmosphere within the range of ~50–250 bar H2O and ~10–55 bar CO2 could have been lost via hydrodynamic escape caused by the high extreme-ultraviolet (EUV) flux of the young Sun during ~0.4–12 Myr, if the impact related energy flux of large planetesimals and smaller planetary embryos to the planet’s surface prevented the steam atmosphere from condensing.
For Mars-sized planetary embryos at 1.5 AU, Lebrun et al. (2013) studied the thermal evolution of early magma oceans in interaction with a catastrophically outgassed steam atmosphere, and found that H2O vapor would start to condense into liquid water ~0.1 Myr after formation if one neglects frequent impacts by large planetesimals or smaller planetary embryos. However, such short condensation time scales contradict the isotopic analysis of Martian SNC (Shergottites, Nakhlites, Chassignites) meteorites (Debaille et al. 2007), where data can be best explained by a progressive crystallization of a magma ocean with a duration of up to ~100 Myr. For this reason Lebrun et al. (2013) suggested that frequent impacts of large planetesimals and small embryos, which have been neglected in their study, may have kept the surface hotter for longer times. In such a case one will obtain a hotter surface that prevents atmospheric H2O vapor from condensing (Hayashi et al. 1979; Genda & Abe 2005). For large planetary embryos that orbit closer around their host star, a steam atmosphere remains in vapor form much longer and is eventually lost to space without condensing to liquids. Thus, the question whether impact induced surface heating keeps steam atmospheres in vapor form longer or prevents the fast condensation of water vapor into liquid H2O is more important for planetary bodies such as Mars that orbit within the ice line but beyond Earth’s orbit location.
Because impact inducted surface heating by planetesimals on early Mars and large Martian-sized planetary embryos in general is crucial for the evolution and growth of terrestrial protoplanets and their initial volatile inventories, we investigate this process in detail. In Sect. 2 we discuss the impact statistics in the early solar system at Mars’ orbit, the impact simulations and applied model, and finally the results. Section 3 elaborates on the implications of our results for magma ocean-based catastrophically outgassed steam atmospheres on early Mars and large planetary embryos in general. Section 4 concludes the study.
2. Surface heating by impacts
We investigate the influence of large-scale asteroid impacts on the surface temperature of the larger collision partner. While the total energy involved in an asteroid impact is given by the kinetic energy of the impactor, it is just an upper limit for the energy that will be available for heating the impact site material (see, e.g., analytic estimations by Celebonovic 2013). We simulate impact events numerically via our own smoothed-particle hydrodynamics (SPH) code and track the efficiency of converting kinetic energy of projectiles into inner energy in the impact region. Given the amount by which the inner energy of the material involved in an impact process increases, we estimate the temperature rise in that area.
2.1. Impact statistics
To understand the duration of a magmatic ocean on early Mars or similar planetary embryos at orbital locations at 1.5 AU, there are several recent studies, where the time scales estimated are quite different. As mentioned before, there is a discrepancy between theoretical models (0.1 Myr, Lebrun et al. 2013) and observations (100 Myr after a geochemical analysis of SNC meteorites, Debaille et al. 2007). Explicitly, theoretical studies do not take into account the impacts of large planetesimals and their possible contribution to the surface temperature on Mars in this early stage during and just after the formation of the planets.
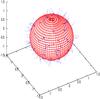 |
Fig. 1 Examples of impacts on Mars: the length of the lines are proportional to the impact velocity, the small dots at the end of the lines are the locations of the impacts on the surface. We note that the length does not differ much from one impact to another (compare Fig. 2 for the impact velocities). |
To determine the statistics of the impact velocities and impact angles on early Mars during the young phases of the solar system we have undertaken extensive numerical integrations in different dynamical models (cf. Maindl & Dvorak 2014). In one model (MI) we distributed planetesimals of different sizes in the region close to Mars with semimajor axes a between 1.3 AU <a< 1.8 AU and eccentricities e< 0.15; in another one (MII) we distributed them in the region around a ~ 3 AU with larger eccentricities (e ~ 0.5) and consequently they have larger velocities in the distance of Mars (close to their perihelion). We assume MI and MII to be representative scenarios with MI representing near-Mars asteroids analogous to the near-Earth asteroids, whereas the MII group consists of asteroids strongly perturbed by Jupiter causing an outer edge of the asteroid belt at about 3.4 AU owing to the 2:1 mean motion resonance. In Fig. 1, we show a sample of impacts on the surface of Mars, all from the MI model.
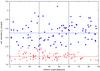 |
Fig. 2 Impact velocities (y-axis) versus the collision angle (x-axis) for a sample of our runs in MI (solid red triangles) and MII (solid blue squares). The two horizontal lines show the mean values at 1.98 vesc and 2.52 vesc in the respective models. The vertical lines divide the impact angles into three equal intervals; we note that whereas the impacts in model MI are rare between 60 and 90 degrees, the impacts in MII are almost equally distributed. |
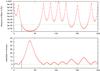 |
Fig. 3 Detailed scenario of the impact velocities: distance to the center of Mars (upper graph) and velocity (lower graph) versus time-integration steps during an encounter (x-axis). The horizontal lines represent the Martian radius and the surface escape velocity, respectively. The vertical lines mark the collision event. We note that the time steps taken by the adaptive step-size integration scheme (red dots) vary according to the acceleration of the body between 0.02 days at a distance of 10-4 AU to a few minutes close to the center. |
It turned out that in model MII the collision velocities are only about 20% larger than in the MI model; the latter show impact velocities of about 10 km s-1, which is around twice the surface escape velocity of Mars vesc. We show the results in Fig. 2 where we plot the collision velocities versus the impact angles for the two models. The blue squares show collisions in MII, the red triangles in MI. The relatively large velocities can be explained by the fact that inside the Hill sphere (0.00386 AU) the gravitational force of the planet dominates the Sun’s gravitation and the respective planetocentric orbit is a hyperbola with increasing velocities closer to the planet. In Fig. 3 we show eight close encounters inside a sphere of 0.0001 AU around Mars. Out of these encounters of a planetesimal with the planet three are real collisions with Mars (the green line in the upper graph denotes the radius of Mars at 2.3 × 10⁻⁵ AU). In our integration of the equations of motion with an n-body code (Lie-integration, see Hanslmeier & Dvorak 1984), where we use mass points for all bodies involved, the orbit seems to continue even inside Mars, but in fact we determine the impact velocity and impact angle just at the surface of Mars. The upper limit of the integration time was in some cases 10 Myr and the number of bodies was on the order of several thousands with different masses. In MI we fully took into account the gravitational interaction of all bodies involved, in MII (e ~ 0.5) we used a simplified model – the elliptic restricted three-body problem – which was found to give similar results to the full n-body problem for highly eccentric orbits, but only for large eccentricities.
To find out how many bodies of a certain mass collide with Mars during a period of 1 Myr, first of all we determined the number of collisions of a given set of bodies with Mars during the integration. We found a collision rate of about 1.5% of the bodies impacting Mars per Myr considering MI only, which proved to be largely independent of body size as long as mutual interaction is negligible. The distribution of the sizes and masses of the bodies is given by a power law (Wyatt 2009), which reads 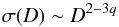 (1)with D denoting the body diameter. From this formula it follows that with q values between 5/3 and 2 the number is dominated by small objects whereas the mass is dominated by the big bodies. Following Ivezić et al. (2001), Davis et al. (2002) we assume two different power laws for the small and large ends of the size distribution. Using q = 2 for body sizes D ≥ 3 km and q = 7 / 6 (yielding an exponent of − 1.5 in the differential distribution) for smaller asteroids, we find most of the mass in D ≈ 3 km objects. Hence, we consider sizes from D = 200 m to D = 100 km to cover the most significant impacts. Assuming a total mass of about 6 × 10⁻³MEarth in asteroids in this size interval – which corresponds to roughly 12 times today’s asteroid belt – we can use (1) to determine an approximated size distribution of objects possibly colliding with early Mars. In addition, by applying our determined collision rate of 1.5% per Myr we estimate the impact rates and total kinetic energy of bodies of different sizes as given in Table 1. For subsequent investigations we do not take into account the results of the MII simulations because the contribution to impacts is significantly less (only a few percentage points) compared to the MI impacts (e.g., Horner & Jones 2010; Morbidelli et al. 2002).
Impact statistics onto Mars in the early solar system.
2.2. Impact simulations
2.2.1. Impact modeling
We model impacts onto the surface of Mars with our 3D solid-body continuum mechanics SPH code introduced and discussed in Schäfer (2005) and Maindl et al. (2013) that includes the full elasto-plastic continuum mechanics model as formulated e.g., in Maindl et al. (2014) , and implements the Grady-Kipp fragmentation model (Grady & Kipp 1980) for treating fracture and brittle failure as discussed in Benz & Asphaug (1994). First-order consistency is achieved by applying a tensorial correction along the lines of Schäfer et al. (2007); dissipation of kinetic energy into heat is modeled via tracking inner energy including viscous energy terms originating from artificial viscosity (Monaghan & Gingold 1983). As we expect the inner energy processes to happen immediately after the impact with negligible contributions from re-accreted ejecta, we do not include self gravity in the calculations.
The Mars surface and projectile material behavior is modeled via the Tillotson equation of state (Tillotson 1962) assuming that both are made of basalt. The according parameters along with the Weibull distribution parameters are the same as used by Maindl et al. (2013).
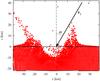 |
Fig. 4 Impact geometry – the projectile hits the surface of Mars (horizontal line) at velocity vi at an angle α. The snapshot shows the situation 75 s after the impact of a 5 km-diameter asteroid hitting the surface at vi = 7.5 km s-1 and α = 30°. The data shown is a cut along the plane spawned by the projectile’s velocity vector and a vector perpendicular to the planet’s surface. |
Our impact simulations use approximately 500 000 SPH particles per scenario and model part of the Mars surface as the target and a spherical projectile that impacts the target at an impact angle α and velocity vimp. The angle is defined such that a vertical head-on impact corresponds to α = 0 (cf. Fig. 4). Experiments with fewer SPH particles (100 k, 200 k, 300 k, and 400 k) confirm that the chosen resolution is suitable because the numerical values of the quantities of interest converge even for smaller particle numbers. The dimensions of the target are chosen such that boundary effects are minimized during the integration timespan (the kinetic and inner energy levels reach an equilibrium before the shock front reaches the boundary of the modeled volume). Because the actual number of SPH particles is kept constant at NSPH = 489,285, the (constant) smoothing lengths and the time interval δt between output frames (the time integration itself always uses an adaptive step-size though) differ for different size scenarios (characterized by the projectile radius rP): δt = rP × 2 × 10⁻⁴ s, the smoothing lengths vary between 125 m and 18.7 km for the investigated rP-range of 100 m ≤ rP ≤ 15 km.
2.2.2. Simulation results
We find that as expected a large fraction of the available energy E – which equals the projectile’s kinetic energy – is converted into inner energy Ei and is available for heating the surrounding matter. The energy Ei used here is the SPH inner energy (see, e.g., Eq. (6) in Maindl et al. 2014). As shown in Fig. 5 as an example, the inner energy becomes stationary very quickly after the impact (after less than 2 s in the shown example of a rP = 500 m impactor), which confirms our assumption of neglecting gravity in the simulations. Based on simulating the interaction between impactors in our size and velocity range with the early Martian atmosphere (Dorfi, priv. comm.) we do not treat this interaction in this paper.
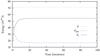 |
Fig. 5 Example for the time evolution of total energy E (dotted red), kinetic energy Ekin (dashed blue), and inner energy Ei (solid black). This is the rP = 500 m, vi = 10 km s-1, α = 30° scenario. One time iteration corresponds to 0.1 s. |
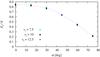 |
Fig. 6 Energy conversion efficiency for different impact angles. The fraction of the total available impact energy E = Ekin, projectile that is converted into inner energy Ei is largely independent from the impactor size and velocity vi (only dependency on velocity is shown), but significantly decreases for inclined impacts (large impact angle α). The impact velocity vi is given in km s-1. |
While there is only a weak dependency of the stationary Ei/E-values on the projectile size rP (less than 0.01 over the investigated rP-interval) and the impact velocity vi, the converted kinetic energy decreases significantly for larger impact angles. Figure 6 shows the conversion efficiency for impacts with vi = 7.5, 10, and 12.5 km s-1 (equaling about 1.5, 2, and 2.5 vesc, respectively). The points correspond to average values of collision scenarios with projectiles between 100 m and 15 km radius – the variations are about the size of the plotting symbols – for impact angles between 0 and 75 degrees. While vertical impacts convert about 85%, only slightly more than 20% of the energy is available for heating at impacts at α = 75°. The remaining kinetic energy of the projectile is consumed by possibly vaporized ejecta and vertical and horizontal material displacement and convection after the impact. This effect is more noticeable for inclined impacts. The chosen Tillotson equation of state distinguishes between a compressed domain (no vaporization) and a expanded domain (vaporization), but does not track phase changes per se (e.g., Melosh 1989). Hence, we expect to overestimate the Ei-values available for heating by the amount of the latent heat of the molten or vaporized mass fraction (which is unknown) and the energy in elastic loading of the material so that the estimates given here serve as an upper limit.
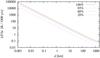 |
Fig. 7 First approximation to the contribution to temperature increase ΔT per 1000 years from inner energy deposited into the planetary surface for different conversion efficiencies Ei/E from 20% to 100%. It is assumed that heat propagation only takes place in a layer of thickness d; cooling is neglected. |
Depositing an amount of energy ΔE onto a planetary surface can contribute to a temperature increase. Neglecting cooling processes and assuming a uniform bombardment of Mars’ surface the contribution ΔT to heat a surface layer of thickness d can be expressed as ![Mathematical equation: \begin{eqnarray} \Delta T = \Delta E\,\left\lbrace \frac{4\pi}{3}\,c_{p}\,\rho\,\left[r_\mathrm{Mars}^3 - \left( r_\mathrm{Mars}-d\right)^3\right]\right\rbrace ^{-1} \end{eqnarray}](/articles/aa/full_html/2015/02/aa24256-14/aa24256-14-eq72.png) (2)with the mean surface material density ρ, specific heat cp and Mars’ mean radius rMars. The parameter d should be chosen to match the depth where heating processes from the planet’s interior start to occur. Assuming an average specific heat capacity close to that of basalt (cp = 800 J kg-1 K-1), heat propagation only in a layer of thickness d, and adopting the impact statistics from Table 1 (asteroids’ kinetic energy influx 26.19 J Myr-1, about 5 × 10⁸ impacts per Myr) we obtain a first approximation to the upper limit of how much the impacts contribute to increasing the surface temperature. Figure 7 gives this data for different conversion efficiencies Ei/E. Considering the dominant MI scenario with most collisions occurring at angles ≲ 60° (Fig. 2) we assume an average efficiency of ~ 60% (Fig. 6). According to Elkins-Tanton (2008) a magma ocean on Mars could have had depths between 500 km and 2000 km. While impacts would not be able to significantly contribute to keeping such a thick layer liquid, they might be able to keep the surface molten. This will cause the surface temperature to stay high enough so that the overlaying steam atmosphere will not reach the condensation temperature as quickly as it would if the surface cooled and was solid, for instance. This is not related to outgassing, but to keeping the surface temperature on a high value.
(2)with the mean surface material density ρ, specific heat cp and Mars’ mean radius rMars. The parameter d should be chosen to match the depth where heating processes from the planet’s interior start to occur. Assuming an average specific heat capacity close to that of basalt (cp = 800 J kg-1 K-1), heat propagation only in a layer of thickness d, and adopting the impact statistics from Table 1 (asteroids’ kinetic energy influx 26.19 J Myr-1, about 5 × 10⁸ impacts per Myr) we obtain a first approximation to the upper limit of how much the impacts contribute to increasing the surface temperature. Figure 7 gives this data for different conversion efficiencies Ei/E. Considering the dominant MI scenario with most collisions occurring at angles ≲ 60° (Fig. 2) we assume an average efficiency of ~ 60% (Fig. 6). According to Elkins-Tanton (2008) a magma ocean on Mars could have had depths between 500 km and 2000 km. While impacts would not be able to significantly contribute to keeping such a thick layer liquid, they might be able to keep the surface molten. This will cause the surface temperature to stay high enough so that the overlaying steam atmosphere will not reach the condensation temperature as quickly as it would if the surface cooled and was solid, for instance. This is not related to outgassing, but to keeping the surface temperature on a high value.
One should note that in our model for the conversion of Ekin into Ei we assumed that the surface – and the impactors – consist of solid basalt. While this holds for larger asteroids like those under consideration (rP ≳ 100 m), the liquid state of an existing magma ocean is beyond this model. As we have shown, however, the heating takes place immediately after the impact and hence in the immediate neighborhood of the impact site where the material is completely damaged. From the simulation point of view it then behaves like a liquid and it is up to future investigations to study the effects of varying material parameters on the energy conversion phenomena.
3. Influence on catastrophically outgassed steam atmospheres
According to Lebrun et al. (2013), who studied the thermal evolution of an early Martian magma ocean in interaction with a catastrophically outgassed ~43 bar H2O and ~14 bar CO2 steam atmosphere, water vapor from such an atmosphere would start to condense at an orbit location of ~1.5 AU into liquid H2O after ~0.1 Myr.
One should also note that impactors will erode the atmosphere or deliver volatiles (e.g., Melosh & Vickery 1989; Ahrens 1993; Shuvalov & Artemieva 2001; Pierazzo & Collins 2004; Svetsov 2007; Pham et al. 2009). The main parameter for atmospheric erosion by impacts is the critical mass mcrit of the body that strikes the planet and the total mass above the plane tangent mtan to the surface at the impact point that can escape. The early low value of the ratio mcrit/mtan of ~ 1 as suggested by Melosh & Vickery (1989) would have efficiently removed atmospheric gas from a Mars-like planet, has been revised more recently to ~10 (Vickery 1990; Manning et al. 2006). Furthermore, several hydrocode simulations performed by Shuvalov & Artemieva (2001), Ivanov (2001), Hamano & Abe (2005), and Svetsov (2007) yield results compatible with much larger values of mcrit/mtan between 50−2000. Ratios ≥30 accumulate atmosphere from several mbar up to more than 10 bar if mcrit/mtan reaches a value of 2400 (see Fig. 6 in Lammer et al. 2013). On the other hand, values of mcrit/mtan between 10−30 can remove some atmosphere, but not very efficiently, since even for the most favorable conditions, a 1 bar protoatmosphere could not have been eroded to present values over the age of the solar system (Shuvalov & Artemieva 2001; Ivanov 2001; Svetsov 2007; Pham et al. 2009; Lammer et al. 2013,and references therein). Thus, impact erosion seems to be a less efficient atmosphere escape process compared to hydrodynamic loss powered by the soft X-rays and extreme ultraviolet (XUV) radiation of the young active Sun, that was expected to be about 100 times higher compared to today’s solar value (Ribas et al. 2005; Claire et al. 2012). In the case where impactors deliver volatiles to the protoatmosphere, these volatiles would be incorporated and be affected by hydrodynamic thermal escape afterwards, similar to the initially catastrophically outgassed steam atmosphere.
Although impact related atmospheric erosion or delivery of volatiles by the impactor are planned to be included in future studies, in the present study we neglect the above mentioned effects because they are less efficient compared to thermal atmospheric escape caused by the high XUV flux of the young Sun, so that our results will most likely be modified in a negligible way.
For the estimation of the XUV-powered thermal escape rates and thus the stability of such an atmosphere, we apply the radiation absorption and a non-stationary 1D hydrodynamic upper atmosphere model that solves the hydrodynamic equations for mass, momentum, and energy conversation in spherical coordinates which is described in detail in Erkaev et al. (2013, 2014) to the steam atmosphere assumed by Lebrun et al. (2013). As described in Erkaev et al. (2014) one can assume that dissociation products of H2O molecules and CO2 molecules should also populate the lower hydrogen dominated thermosphere; we apply the same method, discussed in detail in Hunten et al. (1987), Zahnle et al. (1990), and Erkaev et al. (2014), to the loss of these heavier species that are dragged by the dynamically outward flowing bulk atmosphere.
The incoming high XUV flux (Güdel 2007), which heats the thermosphere, decreases because of absorption near the mesopause/homopause level through dissociation and ionization of H2O and H2 molecules. We assume that atomic hydrogen is the dominant species in the upper atmosphere. We estimate the heating efficiency that corresponds to the fraction of absorbed XUV radiation which is transformed into thermal energy to be 15%. This value is in agreement with various studies (Chassefière 1996; Yelle 2004; Shematovich et al. 2014).
As in Erkaev et al. (2014) and in agreement with Kasting & Pollack (1983) and Tian et al. (2005) we assume an atomic hydrogen density of 1013 cm-3 at the lower boundary i.e., the mesopause/homopause level of the hydrogen-rich upper atmosphere. According to Marcq (2012) who used a 1D radiative-convective atmospheric model to study the coupling between magma oceans and overlaying steam atmospheres for corresponding surface temperatures that are within a range of a few hundred to a few thousand Kelvin, the mesopause/homopause level can move to higher altitudes. As discussed in Erkaev et al. (2014) in the case of a low gravity body such as Mars, this altitude where the atmospheric temperature is similar to the effective temperature can – for surface temperatures of around 500–1000 K – reach an altitude of ~1000 km above the planet’s surface. Because of the expansion of the steam atmosphere above the hot surface we apply our model to a mesopause/homopause location (i.e. lower boundary level) at 1000 km.
The H2O molecules in the outgassed steam atmosphere will be dissociated in the upper atmosphere by the high XUV flux of the young Sun (Chassefière 1996; Erkaev et al. 2014). Tian et al. (2009) applied a photochemcial model to an early Mars atmosphere and showed that for XUV fluxes that are ~10 times higher than today’s Sun, CO2 molecules in the Martian upper atmosphere will also be dissociated so that dissociation products can be dragged by the hydrodynamic outward flowing hydrogen atoms. By applying the model of Erkaev et al. (2014) with the before mentioned initial conditions and an XUV flux that was 100 times higher compared to that of the present Sun, we obtain H escape rates of ~ 7 × 1032 s-1. Figure 8 shows the temporal evolution of the partial surface pressures of H, O, and CO2 normalized to the initial total surface pressure for a catastrophically outgassed steam atmosphere with 52 bar H2O and 11 bar CO2 that is comparable to that studied by Lebrun et al. (2013). One can see that such an atmosphere would be lost during about 0.6 Myr after its origin.
The results of our impact study indicate that a frequent bombardment of large planetesimals within the size-range shown in Table 1 could contribute to a temperature enhancement of several hundred Kelvin near the surface so that the surface temperature rises to higher values than that of ~500 K modeled for the so-called Mush stage by Lebrun et al. (2013).
In such a case the hot surface temperatures caused by impacts would prevent condensation of outgassed steam atmospheres that are denser than in our example shown in Fig. 8. As a consequence a frequent bombardment of large planetesimals will also prevent the formation of liquid water on the Martian surface during the first several million years, and in combination with the XUV powered hydrodynamic escape will also prevent the formation of a dense atmosphere during the early history of Mars.
One should note that for the surface temperatures of ~500 K, which are expected during the Mush stage (Lebrun et al. 2013), according to Kasting (1988) H2O vapor mixing ratios at the mesopause level will also be ~1. For that reason H2O should continue to escape effectively, even if there are periods of condensed liquid water on the planet’s surface. However, as mentioned before frequent impacts as modeled in this study will also evaporate lakes or most likely prevent the formation of large lakes or oceans during the XUV saturation phase of the young Sun. On the other hand, as discussed in Lammer et al. (2013) impacts may also deliver additional volatiles that could be incorporated in the planetary environment after the XUV flux of the young Sun has decreased after the first few 100 Myr so that a secondary atmosphere could grow. However, the surface temperature enhancement by frequent impacts during the first 100 Myr should keep a catastrophically outgassed steam atmosphere at 1.5 AU in vapor form longer than 0.1 Myr, at least periodically.
We assume the before mentioned initial conditions and the steam atmosphere as supposed by Lebrun et al. (2013) and expose it to a XUV flux during the activity saturation phase of the young Sun that was ~44 times higher compared to that of the present Sun at 1.5 AU (Ribas et al. 2005; Claire et al. 2012). Our escape model yields a H escape rate of ~ 7 × 1032 s-1 and the loss of an outgassed steam atmosphere with 52 bar H2O and 11 bar CO2 (Lebrun et al. 2013; Erkaev et al. 2014) after ~0.6 Myr. According to Erkaev et al. (2014) such an initially outgassed steam atmosphere corresponds to a magma ocean depth of about 500 km and initial water and CO2 mixing ratios of 0.1 wt-% and 0.02 wt-%, respectively. Denser steam atmospheres of up to about 260 bar H2O and 55 bar CO2 that may originate from deeper magma oceans and wetter building blocks as studied by Erkaev et al. (2014) will also be lost in agreement with their study within a period of 3 Myr. Figure 8 shows the temporal evolution of the partial surface pressures Psurf of H, O, and CO2 normalized to the total initial surface pressure Ptotal for an catastrophically outgassed atmosphere of 52 bar H2O and 11 bar CO2. The hydrogen inventory evolves assuming a constant escape rate of ~ 7 × 1032 s-1. Both O and even CO2 molecules are dragged along with the escaping H atoms.
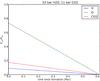 |
Fig. 8 Temporal evolution of the partial surface pressures Psurf of H, O, and CO2 normalized to the total initial surface pressure Ptotal for a catastrophically outgassed atmosphere as discussed in (Lebrun et al. 2013). The hydrogen inventory evolves assuming a constant escape rate of ~ 7 × 1032 s-1 valid for 100 XUV. Both O and even CO2 molecules are dragged along with the escaping H atoms. |
Our finding agrees with the model results of Erkaev et al. (2014) and the hypothesis of Albarède & Blichert-Toft (2007) that the initial catastrophically outgassed Martian H2O and volatile inventory was lost from the protoplanet within the first 100 Myr. The loss of the small planet’s initial H2O inventory may also be a reason that early Mars did not develop a real plate tectonic regime because of the fast hydrodynamic water loss. Water delivered by later impacts during the late veneer or late heavy bombardment phase (Albarède 2009), may have been incorporated by hydrothermal alteration processes such as serpentinization, so that remaining parts of it could be stored in subsurface serpentine even today (Chassefière et al. 2013).
4. Conclusion
We showed that current estimates on impact rates and energies onto Mars in its early phase can account for substantial heating of its surface. Without a cooling mechanism the energy influx and conversion rate into internal energy is sufficient to keep a shallow magma ocean liquid for an extended period of time. This results in higher surface temperatures that keep the outgassed steam atmosphere in vapor form for a longer time and enhances the escape to space. We applied a XUV absorption and 1D hydrodynamic upper atmosphere model to a catastrophically outgassed 52 bar H2O and CO2 steam atmosphere to a 100 times higher XUV flux as expected during the first 100 Myr of the young Sun – an adopted version of the model of Erkaev et al. (2014; no upper/lower atmosphere coupling). We find that under such extreme solar activity-conditions such a steam atmosphere was most likely lost by hydrodynamic escape within ~0.6 Myr. The efficient escape of the bulk hydrogen gas drags heavier atoms and even CO2 molecules to space. Our results are also in agreement with Tian et al. (2009), Lammer et al. (2013), and Erkaev et al. (2014) in that early Mars most likely could not build up a dense CO2 atmosphere during the early Noachian because of rapid escape and impact induced surface heating. Depending on the impact frequency the results of our study also support the SNC-meteorite based hypothesis (Debaille et al. 2007) according to which a shallow magma ocean or impact related sporadically produced shallow magma oceans could have existed during the first 100 Myr on the Martian surface. After the high activity of the young Sun and the impact frequency had decreased, a secondary atmosphere which has been outgassed by volcanic activity or has been delivered by smaller impactors ~4−4.2 Gyr ago could have originated (cf. Grott et al. 2011).
bwGRiD (http://www.bw-grid.de), member of the German D-Grid initiative, funded by the Ministry for Education and Research (Bundesministerium fuer Bildung und Forschung) and the Ministry for Science, Research and Arts Baden-Wuerttemberg (Ministerium fuer Wissenschaft, Forschung und Kunst Baden-Wuerttemberg).
Acknowledgments
R. Dvorak, M. Güdel, K. G. Kislyakova, H. Lammer, T. I. Maindl, and E. Pilat-Lohinger acknowledge the Austrian Science Fund (FWF) for supporting this study via FWF NFN project S11601-N16 “Pathways to Habitability: From Disks to Stars, Planets and Life” and the related FWF NFN subprojects, S11603-N16 “Transport of Water and Organic Material in Early Planetary Systems”, S11604-N16 “Radiation & Wind Evolution from T Tauri Phase to ZAMS and Beyond”, S11607-N16 “Particle/Radiative Interactions with Upper Atmospheres of Planetary Bodies Under Extreme Stellar Conditions”, and S11608-N16 “Binary Star Systems and Habitability”. P. Odert acknowledges support from the FWF project P22950-N16. N. V. Erkaev acknowledges support by the RFBR grant No. 12-05-00152-a. This publication was supported by FWF. The calculations for this work were in part performed on the hpc-bw-cluster – we gratefully thank the bwGRiD project1 for the computational resources. Finally, H. Lammer thanks E. Marcq from LATMOS, Université de Versailles Saint-Quentin-en-Yvelines, Guyancourt, France and L. Elkins-Tanton from the Department of Terrestrial Magnetism, Carnegie Institution for Science, Washington DC 20015, USA, for discussions related to magma oceans and outgassed steam atmospheres. We also wish to thank the anonymous referee for critically reviewing the manuscript and for many suggestions on how to improve it.
References
- Ahrens, T. J. 1993, Rev. Earth Planet Sci., 21, 525 [Google Scholar]
- Albarède, F. 2009, Nature, 461, 1227 [NASA ADS] [CrossRef] [PubMed] [Google Scholar]
- Albarède, F., & Blichert-Toft, J. 2007, Comptes Rendus Geoscience, 339, 917 [NASA ADS] [CrossRef] [Google Scholar]
- Benz, W., & Asphaug, E. 1994, Icarus, 107, 98 [NASA ADS] [CrossRef] [Google Scholar]
- Brasser, R. 2013, Space Sci. Rev., 174, 11 [NASA ADS] [CrossRef] [Google Scholar]
- Celebonovic, V. 2013, Mex. Astron. Astrofis., 49, 221 [NASA ADS] [Google Scholar]
- Chassefière, E. 1996, J. Geophys. Res., 101, 26039 [NASA ADS] [CrossRef] [Google Scholar]
- Chassefière, E., Langlais, B., Quesnel, Y., & Leblanc, F. 2013, J. Geophys. Res. (Planets), 118, 1123 [NASA ADS] [CrossRef] [Google Scholar]
- Claire, M. W., Sheets, J., Cohen, M., et al. 2012, ApJ, 757, 95 [NASA ADS] [CrossRef] [Google Scholar]
- Davis, D. R., Durda, D. D., Marzari, F., Campo Bagatin, A., & Gil-Hutton, R. 2002, Asteroids III, 545 [Google Scholar]
- Debaille, V., Brandon, A. D., Yin, Q. Z., & Jacobsen, B. 2007, Nature, 450, 525 [NASA ADS] [CrossRef] [Google Scholar]
- Elkins-Tanton, L. T. 2008, Earth Plan. Sci. Lett., 271, 181 [Google Scholar]
- Elkins-Tanton, L. T. 2012, Rev. Earth Planet Sci., 40, 113 [Google Scholar]
- Erkaev, N. V., Lammer, H., Elkins-Tanton, L. T., et al. 2014, Planet. Space Sci., 98, 106 [NASA ADS] [CrossRef] [Google Scholar]
- Erkaev, N. V., Lammer, H., Odert, P., et al. 2013, Astrobiology, 13, 1011 [NASA ADS] [CrossRef] [Google Scholar]
- Genda, H., & Abe, Y. 2005, Nature, 433, 842 [NASA ADS] [CrossRef] [Google Scholar]
- Grady, D. E., & Kipp, M. E. 1980, Int. J. Rock Mech. Mining Sci. Geomech. Abstr., 17, 147 [CrossRef] [Google Scholar]
- Grott, M., Morschhauser, A., Breuer, D., & Hauber, E. 2011, Earth Plan. Sci. Lett., 308, 391 [Google Scholar]
- Güdel, M. 2007, Liv. Rev. Sol. Phys., 4, 3 [Google Scholar]
- Hamano, K., & Abe, Y. 2005, LPI Contributions, 1273, 46 [NASA ADS] [Google Scholar]
- Hanslmeier, A., & Dvorak, R. 1984, A&A, 132, 203 [NASA ADS] [Google Scholar]
- Hayashi, C., Nakazawa, K., & Mizuno, H. 1979, Earth Plan. Sci. Lett., 43, 22 [Google Scholar]
- Horner, J., & Jones, B. W. 2010, Astron. Geophys., 51, 16 [CrossRef] [Google Scholar]
- Hunten, D. M., Pepin, R. O., & Walker, J. C. G. 1987, Icarus, 69, 532 [NASA ADS] [CrossRef] [Google Scholar]
- Ivanov, B. A. 2001, Space Sci. Rev., 96, 87 [NASA ADS] [CrossRef] [Google Scholar]
- Ivezić, Ž., Tabachnik, S., Rafikov, R., et al. 2001, AJ, 122, 2749 [NASA ADS] [CrossRef] [Google Scholar]
- Kasting, J. F. 1988, Icarus, 74, 472 [NASA ADS] [CrossRef] [PubMed] [Google Scholar]
- Kasting, J. F., & Pollack, J. B. 1983, Icarus, 53, 479 [NASA ADS] [CrossRef] [Google Scholar]
- Kleine, T., Mezger, K., Münker, C., Palme, H., & Bischoff, A. 2004, Geochim. Cosmochim. Acta, 68, 2935 [NASA ADS] [CrossRef] [Google Scholar]
- Lammer, H. 2013, Origin and Evolution of Planetary Atmospheres (Heidelberg, New York: SpringerBriefs in Astronomy) [Google Scholar]
- Lammer, H., Chassefière, E., Karatekin, Ö., et al. 2013, Space Sci. Rev., 174, 113 [NASA ADS] [CrossRef] [Google Scholar]
- LaTourrette, T., & Wasserburg, G. J. 1998, Earth Plan. Sci. Lett., 158, 91 [NASA ADS] [CrossRef] [Google Scholar]
- Lebrun, T., Massol, H., ChassefièRe, E., et al. 2013, J. Geophys. Res. (Planets), 118, 1155 [Google Scholar]
- Lee, T., Papanastassiou, D. A., & Wasserburg, G. J. 1976, Geophys. Res. Lett., 3, 109 [NASA ADS] [CrossRef] [Google Scholar]
- Maindl, T. I., & Dvorak, R. 2014, in IAU Symp., 299, ed. M. Booth, B. C. Matthews, & J. R. Graham, 370 [Google Scholar]
- Maindl, T. I., Schäfer, C., Speith, R., et al. 2013, Astron. Nachr., 334, 996 [NASA ADS] [CrossRef] [Google Scholar]
- Maindl, T. I., Dvorak, R., Speith, R., & Schäfer, C. 2014, A&A [arXiv:1401.0045] [Google Scholar]
- Manning, C. V., McKay, C. P., & Zahnle, K. J. 2006, Icarus, 180, 38 [NASA ADS] [CrossRef] [Google Scholar]
- Marcq, E. 2012, J. Geophys. Res., 117, 1001 [Google Scholar]
- Melosh, H. J. 1989, Impact cratering: A geologic process (New York: Oxford University Press) [Google Scholar]
- Melosh, H. J., & Vickery, A. M. 1989, Nature, 338, 487 [NASA ADS] [CrossRef] [Google Scholar]
- Monaghan, J. J., & Gingold, R. A. 1983, J. Comput. Phys., 52, 374 [NASA ADS] [CrossRef] [Google Scholar]
- Morbidelli, A., Bottke, Jr., W. F., Froeschlé, C., & Michel, P. 2002, Asteroids III (Tucson: University of Arizona Press), 409 [Google Scholar]
- Morbidelli, A., Lunine, J. I., O’Brien, D. P., Raymond, S. N., & Walsh, K. J. 2012, Rev. Earth Planet. Sci., 40, 251 [Google Scholar]
- Pham, L. B. S., Karatekin, Ö., & Dehant, V. 2009, Astrobiology, 9, 45 [NASA ADS] [CrossRef] [Google Scholar]
- Pierazzo, E., & Collins, G. 2004, in Cratering in Marine Environments and on Ice, eds. H. Dypvik, M. Burchell, & P. Claeys, Impact Studies (Berlin, Heidelberg: Springer), 323 [Google Scholar]
- Ribas, I., Guinan, E. F., Güdel, M., & Audard, M. 2005, ApJ, 622, 680 [NASA ADS] [CrossRef] [Google Scholar]
- Schäfer, C. 2005, Dissertation, Eberhard-Karls-Universität Tübingen [Google Scholar]
- Schäfer, C., Speith, R., & Kley, W. 2007, A&A, 470, 733 [NASA ADS] [CrossRef] [EDP Sciences] [Google Scholar]
- Shematovich, V. I., Ionov, D. E., & Lammer, H. 2014, A&A, 571, A94 [NASA ADS] [CrossRef] [EDP Sciences] [Google Scholar]
- Shuvalov, V. V., & Artemieva, N. A. 2001, in Catastrophic Events and Mass Extinctions: Impacts and Beyond, 3060 [Google Scholar]
- Svetsov, V. V. 2007, Sol. System Res., 41, 28 [NASA ADS] [CrossRef] [Google Scholar]
- Tian, F., Toon, O. B., Pavlov, A. A., & De Sterck, H. 2005, Science, 308, 1014 [NASA ADS] [CrossRef] [PubMed] [Google Scholar]
- Tian, F., Kasting, J. F., & Solomon, S. C. 2009, Geophys. Res. Lett., 36, 2205 [NASA ADS] [CrossRef] [Google Scholar]
- Tillotson, J. H. 1962, Metallic Equations of State for Hypervelocity Impact, Tech. Rep. General Atomic Report GA-3216, General Dynamics, San Diego [Google Scholar]
- Urey, H. C. 1955, Proc. of the National Academy of Science, 41, 127 [NASA ADS] [CrossRef] [Google Scholar]
- Vickery, A. M. 1990, LPI Contributions, 746, 51 [NASA ADS] [Google Scholar]
- Wyatt, M. 2009, in Small Bodies in Planetary Systems, eds. I. Mann, A. Nakamura, & T. Mukai (Heidelberg: Berlin, Springer), Lect. Notes Phys., 758, 1 [Google Scholar]
- Yelle, R. V. 2004, Icarus, 170, 167 [NASA ADS] [CrossRef] [Google Scholar]
- Zahnle, K., Kasting, J. F., & Pollack, J. B. 1990, Icarus, 84, 502 [NASA ADS] [CrossRef] [Google Scholar]
All Tables
All Figures
|
Fig. 1 Examples of impacts on Mars: the length of the lines are proportional to the impact velocity, the small dots at the end of the lines are the locations of the impacts on the surface. We note that the length does not differ much from one impact to another (compare Fig. 2 for the impact velocities). |
| In the text | |
|
Fig. 2 Impact velocities (y-axis) versus the collision angle (x-axis) for a sample of our runs in MI (solid red triangles) and MII (solid blue squares). The two horizontal lines show the mean values at 1.98 vesc and 2.52 vesc in the respective models. The vertical lines divide the impact angles into three equal intervals; we note that whereas the impacts in model MI are rare between 60 and 90 degrees, the impacts in MII are almost equally distributed. |
| In the text | |
|
Fig. 3 Detailed scenario of the impact velocities: distance to the center of Mars (upper graph) and velocity (lower graph) versus time-integration steps during an encounter (x-axis). The horizontal lines represent the Martian radius and the surface escape velocity, respectively. The vertical lines mark the collision event. We note that the time steps taken by the adaptive step-size integration scheme (red dots) vary according to the acceleration of the body between 0.02 days at a distance of 10-4 AU to a few minutes close to the center. |
| In the text | |
|
Fig. 4 Impact geometry – the projectile hits the surface of Mars (horizontal line) at velocity vi at an angle α. The snapshot shows the situation 75 s after the impact of a 5 km-diameter asteroid hitting the surface at vi = 7.5 km s-1 and α = 30°. The data shown is a cut along the plane spawned by the projectile’s velocity vector and a vector perpendicular to the planet’s surface. |
| In the text | |
|
Fig. 5 Example for the time evolution of total energy E (dotted red), kinetic energy Ekin (dashed blue), and inner energy Ei (solid black). This is the rP = 500 m, vi = 10 km s-1, α = 30° scenario. One time iteration corresponds to 0.1 s. |
| In the text | |
|
Fig. 6 Energy conversion efficiency for different impact angles. The fraction of the total available impact energy E = Ekin, projectile that is converted into inner energy Ei is largely independent from the impactor size and velocity vi (only dependency on velocity is shown), but significantly decreases for inclined impacts (large impact angle α). The impact velocity vi is given in km s-1. |
| In the text | |
|
Fig. 7 First approximation to the contribution to temperature increase ΔT per 1000 years from inner energy deposited into the planetary surface for different conversion efficiencies Ei/E from 20% to 100%. It is assumed that heat propagation only takes place in a layer of thickness d; cooling is neglected. |
| In the text | |
|
Fig. 8 Temporal evolution of the partial surface pressures Psurf of H, O, and CO2 normalized to the total initial surface pressure Ptotal for a catastrophically outgassed atmosphere as discussed in (Lebrun et al. 2013). The hydrogen inventory evolves assuming a constant escape rate of ~ 7 × 1032 s-1 valid for 100 XUV. Both O and even CO2 molecules are dragged along with the escaping H atoms. |
| In the text | |
Current usage metrics show cumulative count of Article Views (full-text article views including HTML views, PDF and ePub downloads, according to the available data) and Abstracts Views on Vision4Press platform.
Data correspond to usage on the plateform after 2015. The current usage metrics is available 48-96 hours after online publication and is updated daily on week days.
Initial download of the metrics may take a while.