Fig. 2
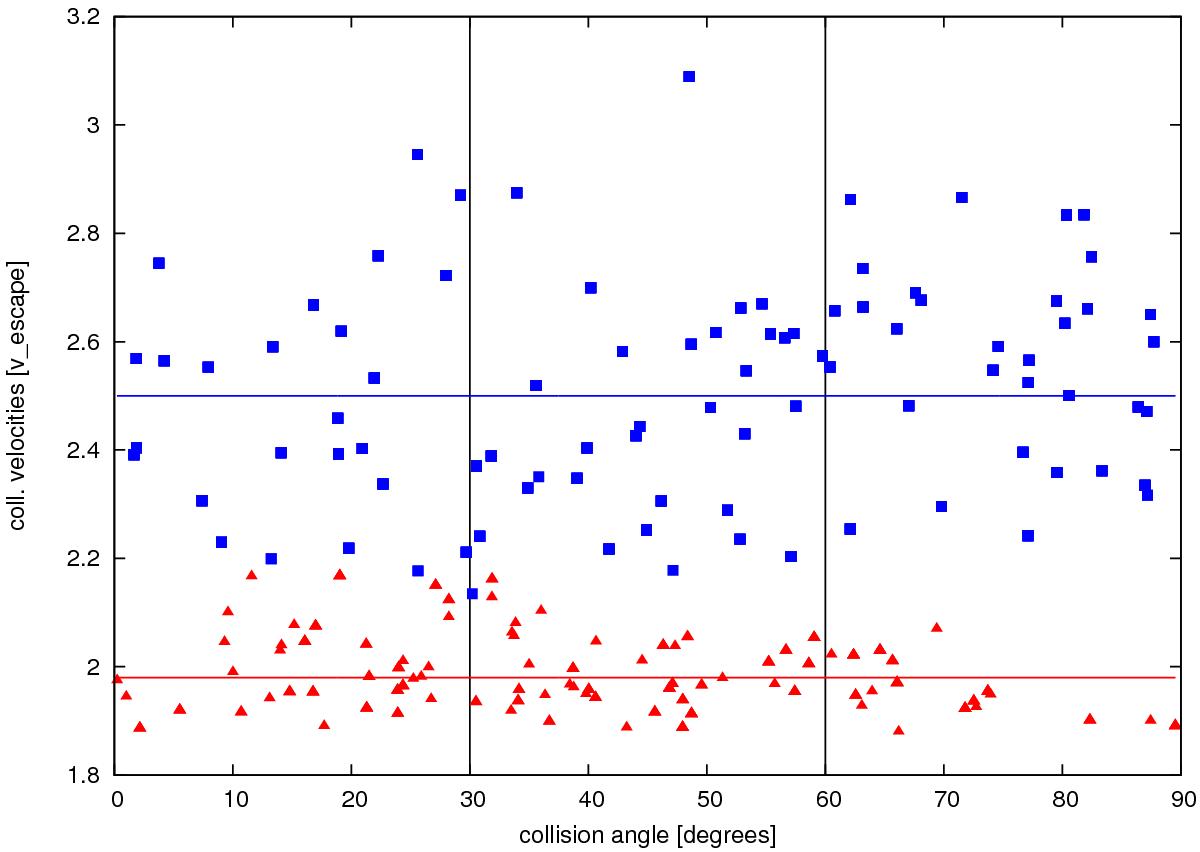
Impact velocities (y-axis) versus the collision angle (x-axis) for a sample of our runs in MI (solid red triangles) and MII (solid blue squares). The two horizontal lines show the mean values at 1.98 vesc and 2.52 vesc in the respective models. The vertical lines divide the impact angles into three equal intervals; we note that whereas the impacts in model MI are rare between 60 and 90 degrees, the impacts in MII are almost equally distributed.
Current usage metrics show cumulative count of Article Views (full-text article views including HTML views, PDF and ePub downloads, according to the available data) and Abstracts Views on Vision4Press platform.
Data correspond to usage on the plateform after 2015. The current usage metrics is available 48-96 hours after online publication and is updated daily on week days.
Initial download of the metrics may take a while.