Fig. 3
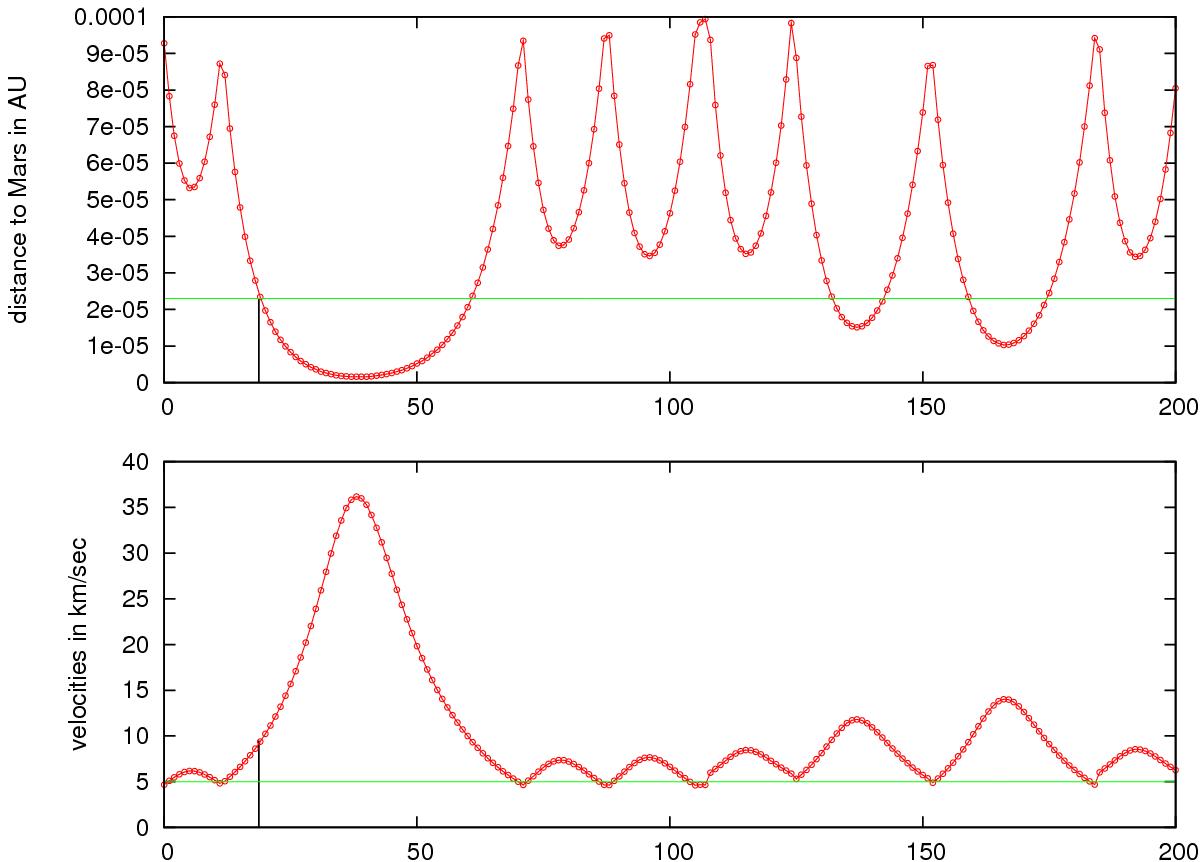
Detailed scenario of the impact velocities: distance to the center of Mars (upper graph) and velocity (lower graph) versus time-integration steps during an encounter (x-axis). The horizontal lines represent the Martian radius and the surface escape velocity, respectively. The vertical lines mark the collision event. We note that the time steps taken by the adaptive step-size integration scheme (red dots) vary according to the acceleration of the body between 0.02 days at a distance of 10-4 AU to a few minutes close to the center.
Current usage metrics show cumulative count of Article Views (full-text article views including HTML views, PDF and ePub downloads, according to the available data) and Abstracts Views on Vision4Press platform.
Data correspond to usage on the plateform after 2015. The current usage metrics is available 48-96 hours after online publication and is updated daily on week days.
Initial download of the metrics may take a while.