Fig. 11
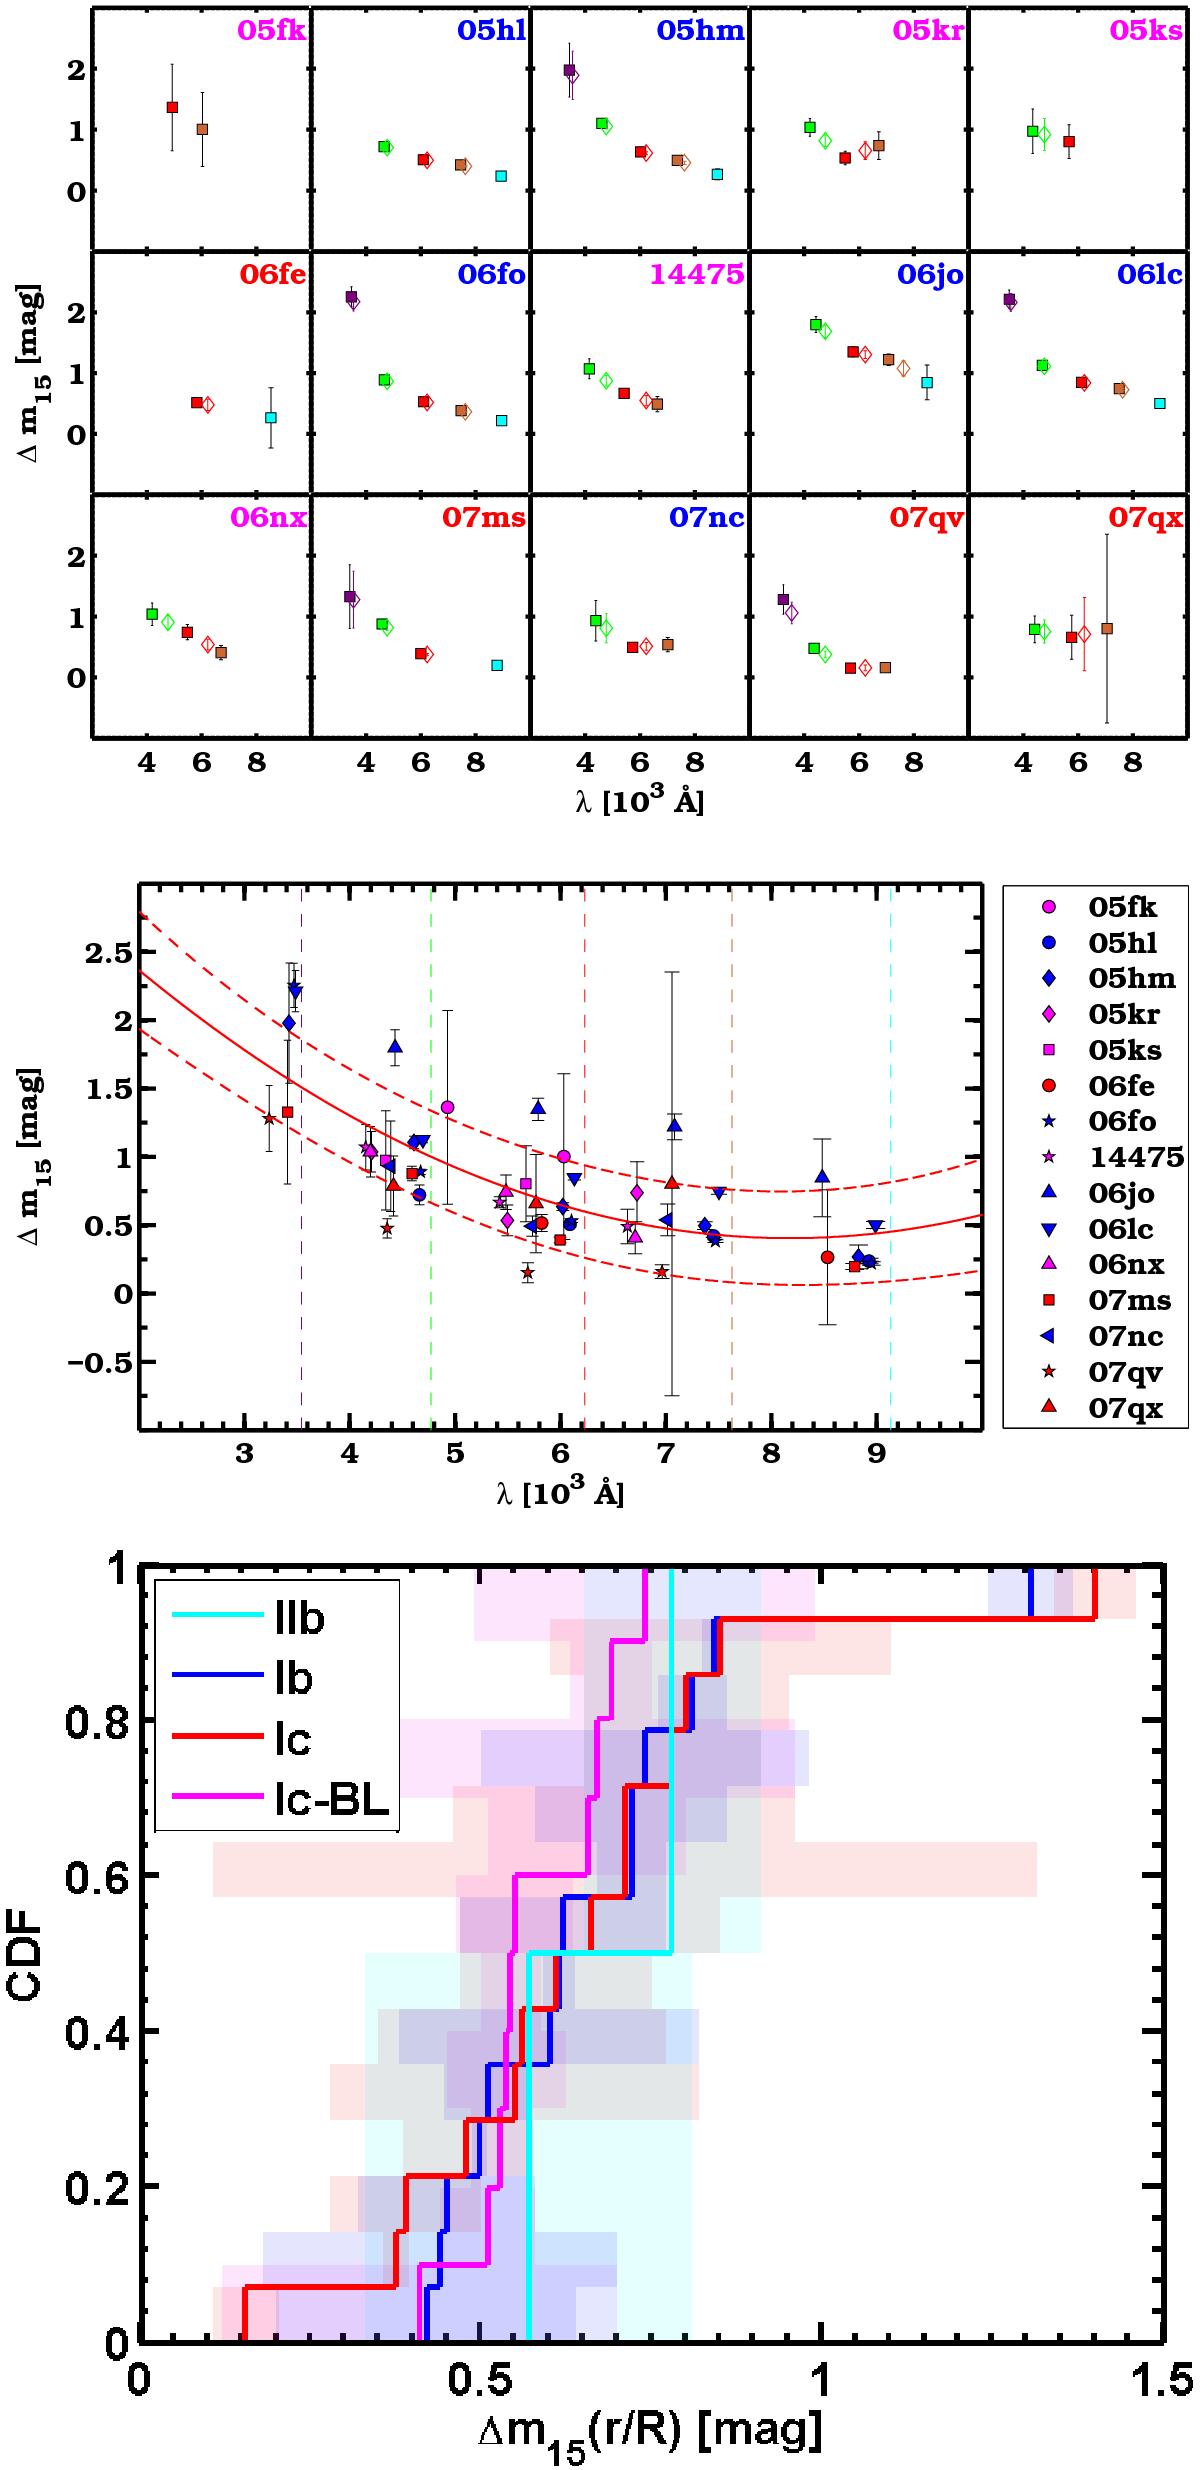
Top panel: Δm15 for 15 SNe Ib/c in the SDSS sample as a function of the effective wavelength of each filter in the SN rest frame (violet, green, red, dark yellow and cyan represent ugriz filters). Bluer bands decline faster than redder bands. Central panel: Same as in the top panel, the 2nd order polynomial fitted to the data (and plotted in red) corresponds to Δm15(λ) = aλ2 + bλ + c, where a = 5.14 × 10⁻⁸, b = −8.41 × 10⁻⁴ and c = 3.84. Δm15 is expressed in magnitudes and λ in Å. Typical 1σ uncertainties on Δm15(λ) are on the order of 0.4 mag. Vertical dashed lines indicate the effective wavelengths for the ugriz filters. Bottom panel: cumulative distribution functions for the r/R-band Δm15 of SNe Ib (14), Ic (14), Ic-BL (10) and IIb (2), from the SDSS sample and from Drout et al. (2011). SDSS Δm15 values are those interpolated at λeff(rz = 0). Shaded areas indicate the uncertainties for Δm15. There is no significant difference among the distributions of the different classes, with p-values >0.05.
Current usage metrics show cumulative count of Article Views (full-text article views including HTML views, PDF and ePub downloads, according to the available data) and Abstracts Views on Vision4Press platform.
Data correspond to usage on the plateform after 2015. The current usage metrics is available 48-96 hours after online publication and is updated daily on week days.
Initial download of the metrics may take a while.