Fig. 10
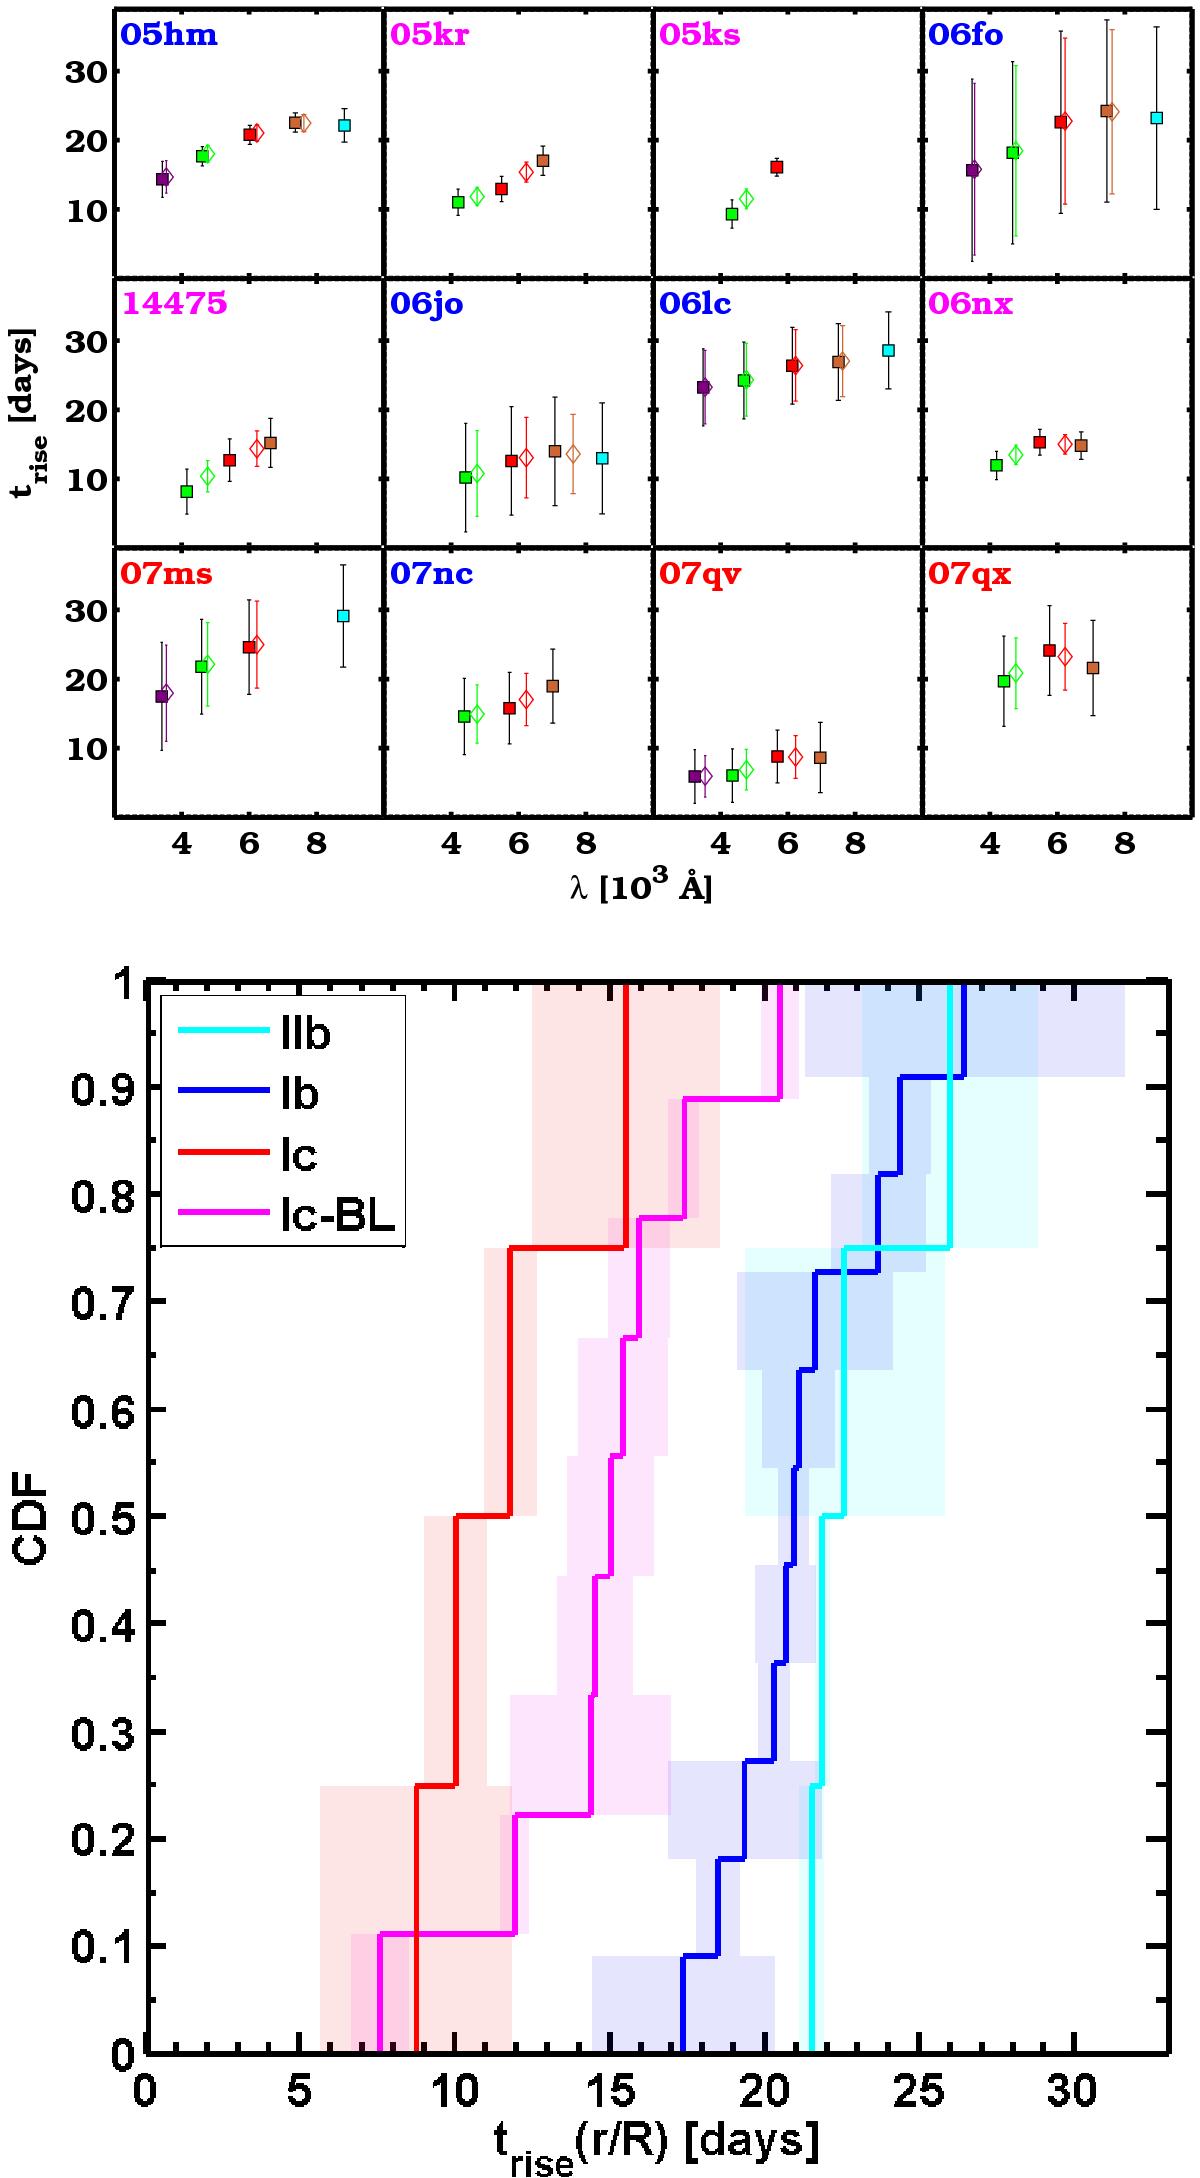
Top panel: rise times for 12 SNe Ib/c in the SDSS sample as a function of the effective wavelength of each filter in the rest frame (violet, green, red, dark yellow, and cyan represent ugriz filters). Bluer bands rise faster than redder bands. Blue, red, and magenta labels correspond to SNe Ib, Ic, and Ic-BL, respectively. Bottom panel: cumulative distribution functions for the r/R-band rise times of SNe Ib (11), Ic (4), Ic-BL (9), and IIb (4), from the SDSS sample and from the literature (see Table 4). Helium-poor SNe (Ic, Ic-BL) rise to maximum in a shorter time than helium-rich transients (Ib, IIb), and this result is statistically significant (p-value <0.05). The shaded areas indicate the uncertainties for the rise times.
Current usage metrics show cumulative count of Article Views (full-text article views including HTML views, PDF and ePub downloads, according to the available data) and Abstracts Views on Vision4Press platform.
Data correspond to usage on the plateform after 2015. The current usage metrics is available 48-96 hours after online publication and is updated daily on week days.
Initial download of the metrics may take a while.