Fig. 9
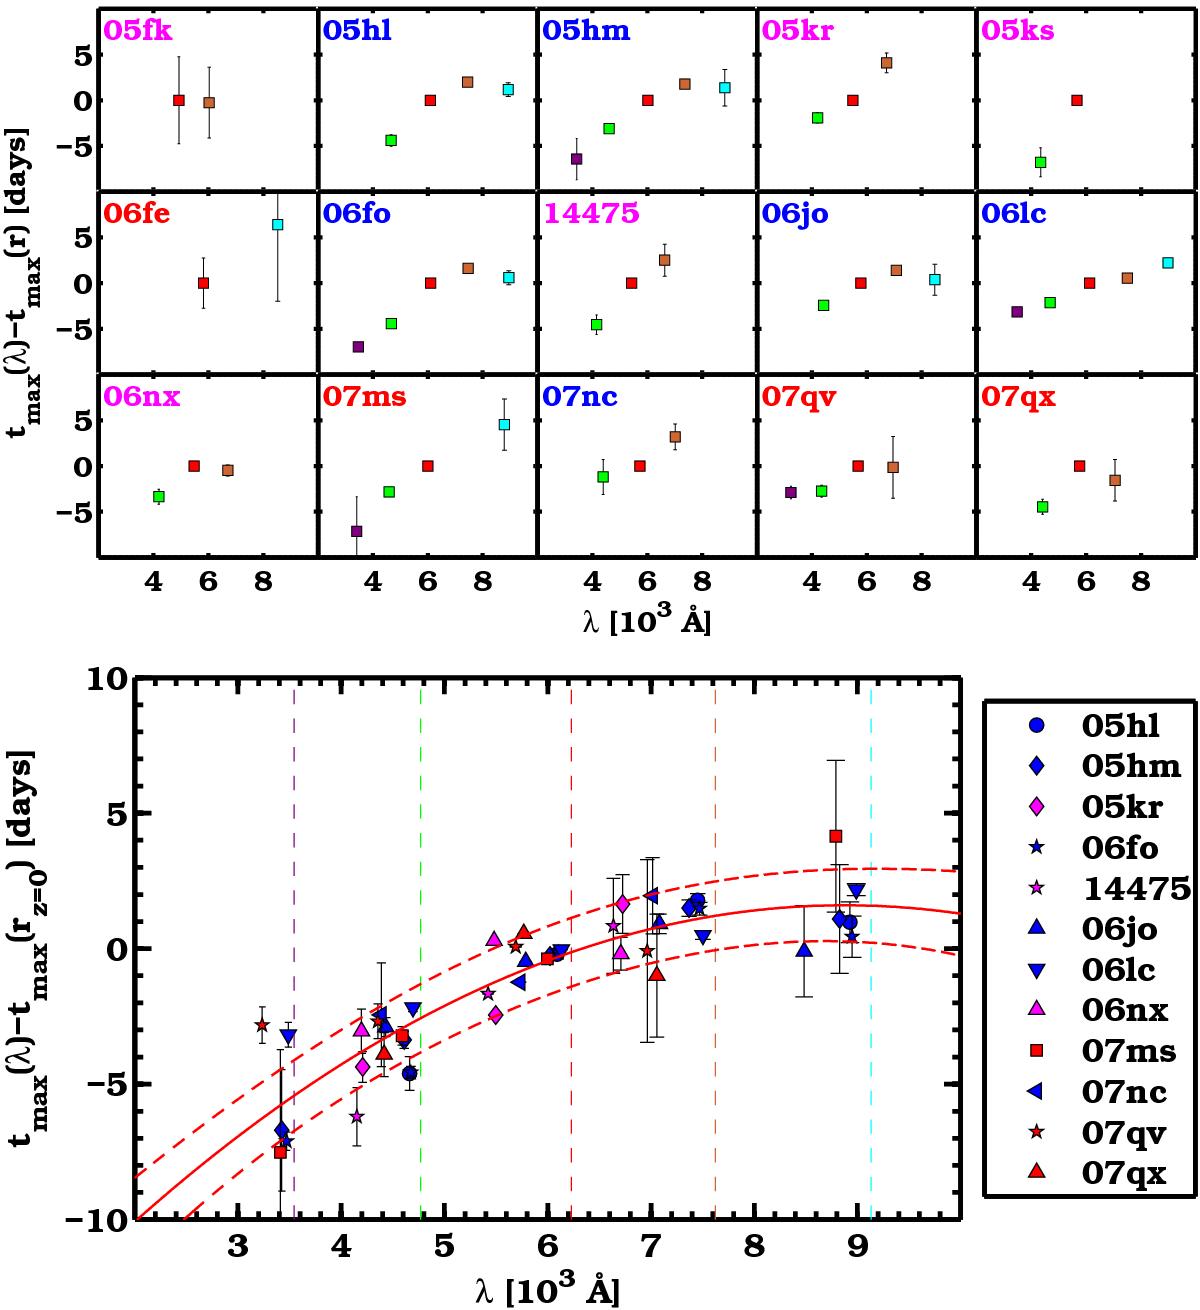
Top panel: epoch of the peak (tmax) for each light curve with respect to tmax in the r band as a function of the effective wavelength of the filters in the rest frame for 15 SNe Ib/c in the SDSS sample (violet, green, red, dark yellow, and cyan represent ugriz filters). Blue, red, and magenta labels correspond to SNe Ib, Ic, and Ic-BL, respectively. Bottom panel: same as in the top panel, but tmax for each light curve and for each object is plotted with respect to the interpolated tmax at the effective wavelength of r band at redshift z = 0 (6231 Å). Three out of 15 objects (SNe 2005fk, 2005ks, 2006fe) are excluded from the fit since the interpolation to 6231 Å is not possible or reliable (e.g., for SN 2006fe, we do not have the i-band maximum epoch). The 2nd-order polynomial fit to the data (and plotted in red) corresponds to tmax(λ) − tmax(rz = 0) = aλ2 + bλ + c, where a = −2.47 × 10⁻⁷, b = + 4.38 × 10⁻³, c = −17.86. tmax is expressed in days and λ in Å. This fit allows predicting peak epochs in the whole optical range given a measured peak in a single band, with little uncertainty (σ = 1.3 days). Vertical dashed lines indicate the effective wavelengths for the ugriz filters.
Current usage metrics show cumulative count of Article Views (full-text article views including HTML views, PDF and ePub downloads, according to the available data) and Abstracts Views on Vision4Press platform.
Data correspond to usage on the plateform after 2015. The current usage metrics is available 48-96 hours after online publication and is updated daily on week days.
Initial download of the metrics may take a while.