Fig. 4
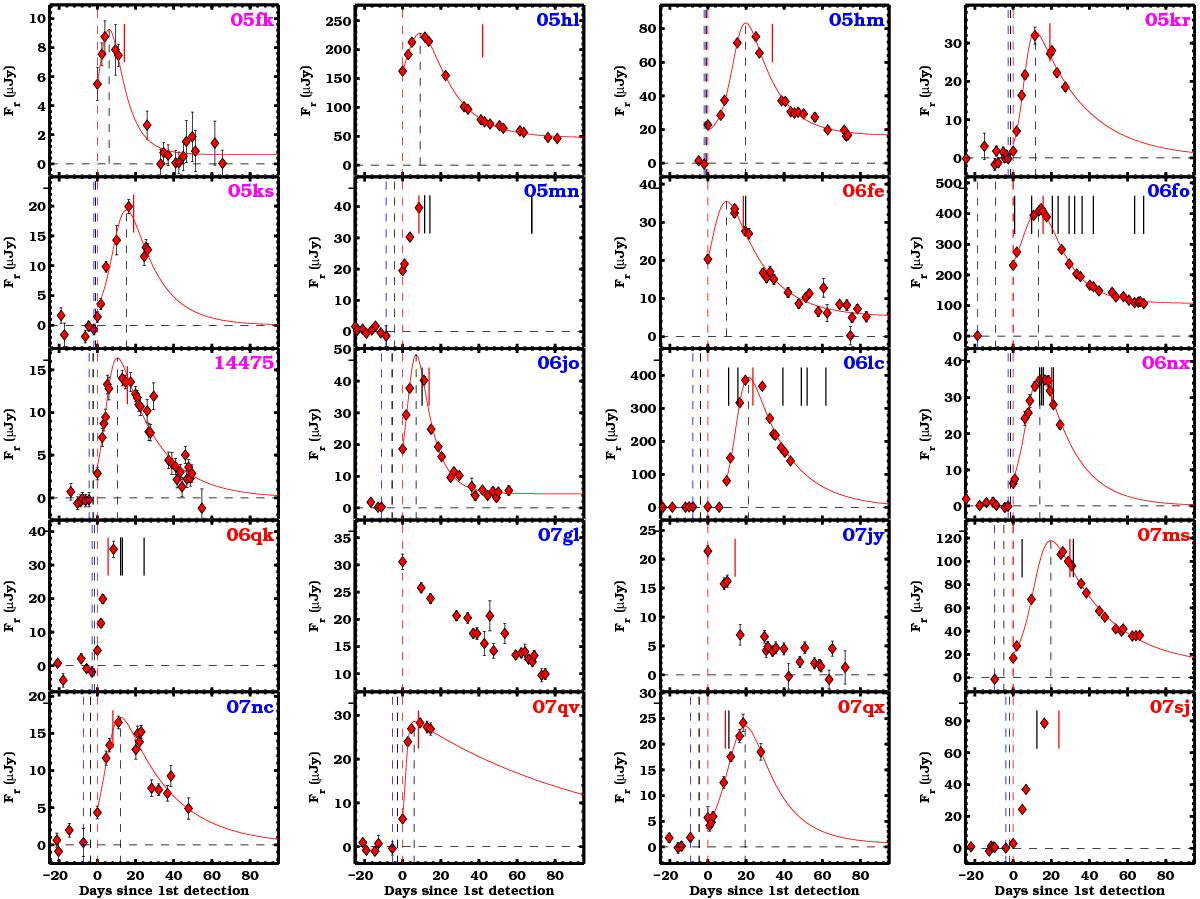
r-band light curves of 20 SDSS SNe Ib, Ic, and Ic-BL. Best fits on the SN light curves observed before the peak are shown by a red solid line. Vertical blue and red dashed lines mark the last non-detection and the first detection epochs. Vertical black dashed lines indicate the derived explosion date and the peak epoch. Black and red vertical segments mark the spectral epochs; in particular, the red ones indicate the epoch of the spectra shown in Fig. 1. Light curves are shown after correction for time dilation. Blue, red, and magenta labels correspond to SNe Ib, Ic, and Ic-BL, respectively.
Current usage metrics show cumulative count of Article Views (full-text article views including HTML views, PDF and ePub downloads, according to the available data) and Abstracts Views on Vision4Press platform.
Data correspond to usage on the plateform after 2015. The current usage metrics is available 48-96 hours after online publication and is updated daily on week days.
Initial download of the metrics may take a while.