Fig. 24
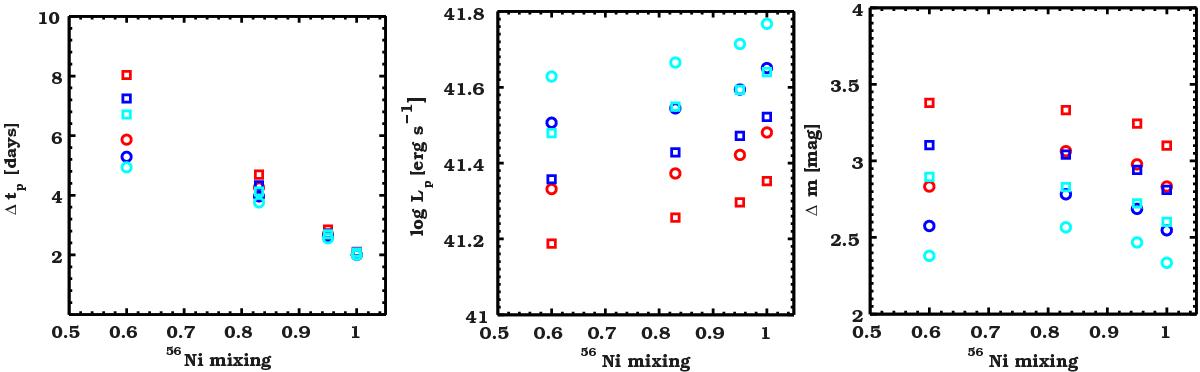
Plateau length (Δtp), luminosity (Lp), and difference in magnitude (ΔM) between Lp and the luminosity peak as functions of 56Ni mixing (56Ni mass is mixed out to 0.60, 0.83, 0.95, and 1.00 of the total progenitor mass). Red, blue, and cyan symbols correspond to models with E = 1,1.5,2 foe, respectively. Circles and squares correspond to models with ejecta mass and progenitor radius Mej = 1.7 /R = 2.5R⊙ and 2.2 M⊙/R = 2.3R⊙, respectively.


Current usage metrics show cumulative count of Article Views (full-text article views including HTML views, PDF and ePub downloads, according to the available data) and Abstracts Views on Vision4Press platform.
Data correspond to usage on the plateform after 2015. The current usage metrics is available 48-96 hours after online publication and is updated daily on week days.
Initial download of the metrics may take a while.