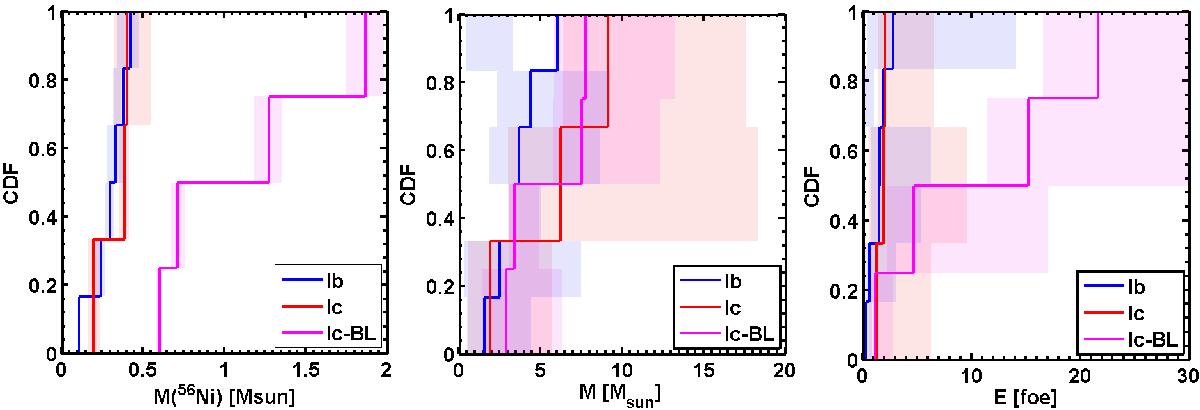
Fig. 23

Lefthand panel: 56Ni mass cumulative distributions for SNe Ib, Ic, and Ic-BL observed at peak. The comparison reveals higher 56Ni masses for SNe Ic-BL (host extinction included). Shaded areas indicate the uncertainties for each SN, caused by the error on the explosion day. Central panel: ejecta mass (M) cumulative distributions for SNe Ib, Ic, and Ic-BL. SNe Ic and Ic-BL appear more massive than SNe Ib, but the uncertainties are large. Righthand panel: explosion energy (EK) cumulative distributions for SNe Ib, Ic, and Ic-BL. SNe Ic-BL are clearly more energetic. We compare our results to those of Cano (2013) and Drout et al. (2011) in Sect. 4.1.
Current usage metrics show cumulative count of Article Views (full-text article views including HTML views, PDF and ePub downloads, according to the available data) and Abstracts Views on Vision4Press platform.
Data correspond to usage on the plateform after 2015. The current usage metrics is available 48-96 hours after online publication and is updated daily on week days.
Initial download of the metrics may take a while.


