Fig. 20
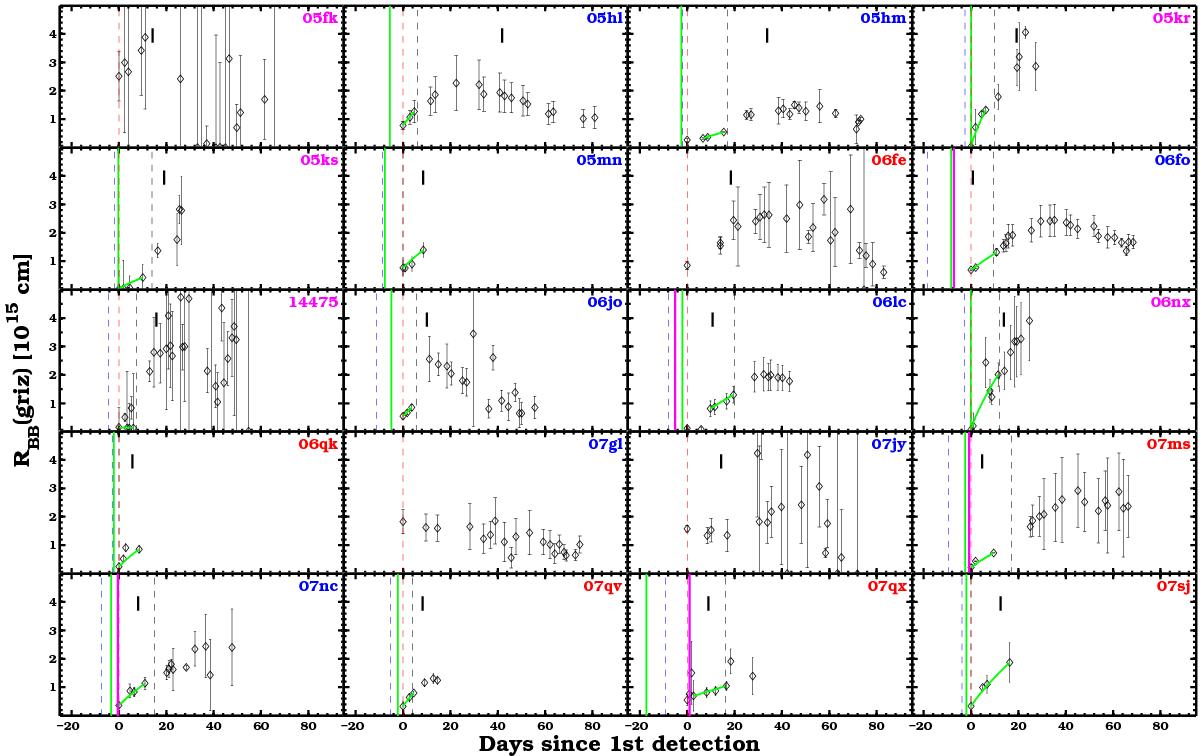
Photospheric radius evolution for the 20 SDSS SNe Ib/c from the BB fits on the griz SEDs. Discovery epochs are marked by red dashed lines, the last non-detections by dashed blue lines. The epoch of the first spectrum is marked by a black segment. Here we include host-extinction corrections. The vertical green line indicates the explosion date as derived from the best PL fit (![]() , see Sect. 3.4.1) on the prepeak BB radii, which is shown with a green solid line. The PL-derived explosion dates show that most of the SNe were discovered at early epochs, when the photospheric radius was remarkably small, and thus that the 56Ni is likely to be present in the outer layers for most of them (see Fig. 1 in PN13 and Sect. 3.4.4). The vertical magenta line indicates the minimum explosion day tmin computed from the spectral velocities (see Sect. 3.4.1). Both tmin and maximum luminosity epochs are marked by black vertical dashed lines. Blue, red, and magenta labels correspond to SNe Ib, Ic, and Ic-BL, respectively.
, see Sect. 3.4.1) on the prepeak BB radii, which is shown with a green solid line. The PL-derived explosion dates show that most of the SNe were discovered at early epochs, when the photospheric radius was remarkably small, and thus that the 56Ni is likely to be present in the outer layers for most of them (see Fig. 1 in PN13 and Sect. 3.4.4). The vertical magenta line indicates the minimum explosion day tmin computed from the spectral velocities (see Sect. 3.4.1). Both tmin and maximum luminosity epochs are marked by black vertical dashed lines. Blue, red, and magenta labels correspond to SNe Ib, Ic, and Ic-BL, respectively.
Current usage metrics show cumulative count of Article Views (full-text article views including HTML views, PDF and ePub downloads, according to the available data) and Abstracts Views on Vision4Press platform.
Data correspond to usage on the plateform after 2015. The current usage metrics is available 48-96 hours after online publication and is updated daily on week days.
Initial download of the metrics may take a while.