Fig. 18
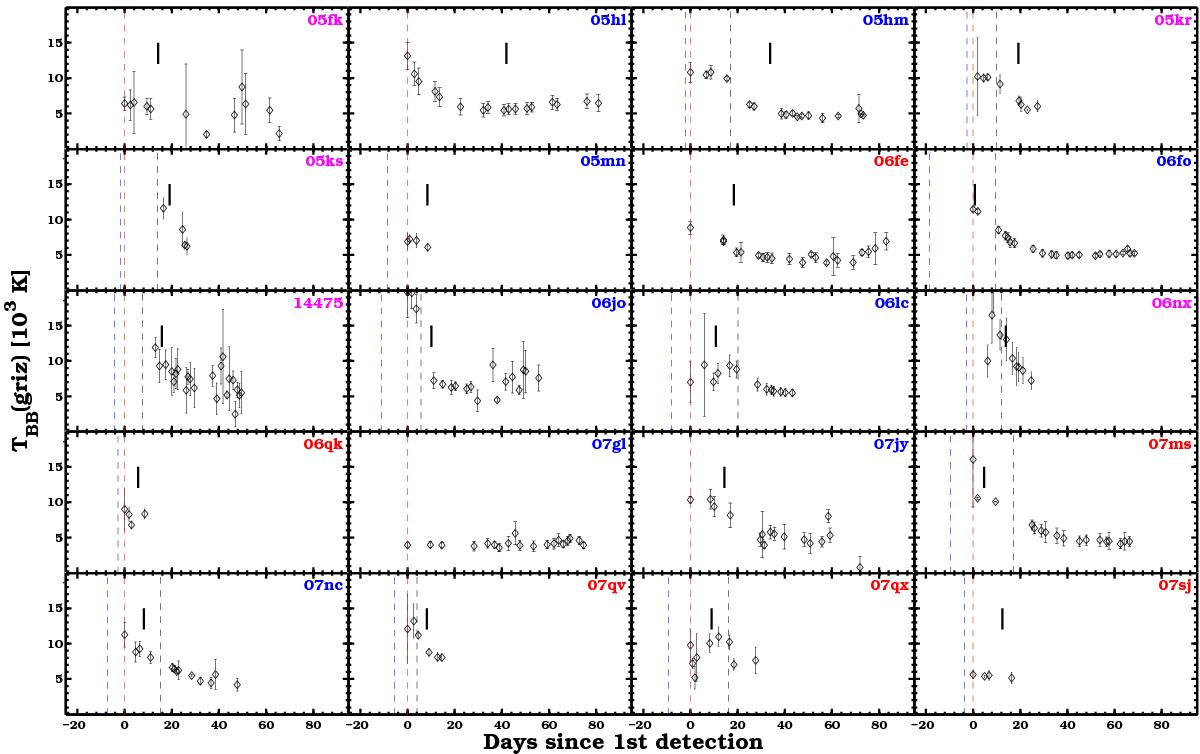
Temperature evolution for the 20 SDSS SNe Ib/c from the BB fits on the griz SEDs. Discovery epochs are marked by red dashed lines, the last non-detections by dashed blue lines. The epoch of the first spectrum is marked by a black segment. Here we include the host-extinction corrections. Maximum luminosity epochs are marked by black, vertical dashed lines. Blue, red, and magenta labels correspond to SNe Ib, Ic, and Ic-BL, respectively.
Current usage metrics show cumulative count of Article Views (full-text article views including HTML views, PDF and ePub downloads, according to the available data) and Abstracts Views on Vision4Press platform.
Data correspond to usage on the plateform after 2015. The current usage metrics is available 48-96 hours after online publication and is updated daily on week days.
Initial download of the metrics may take a while.