Fig. 16
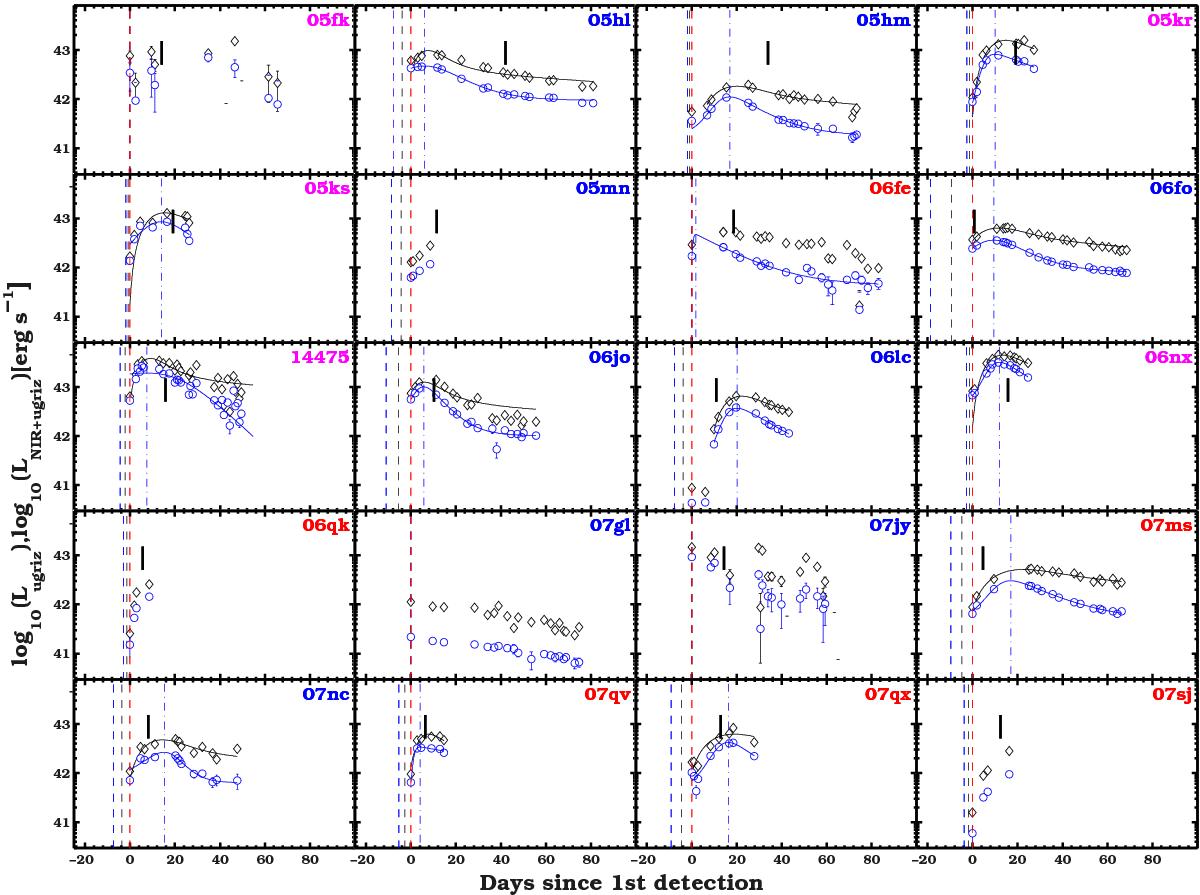
Pseudo-bolometric (Lugriz, blue circles) and bolometric (LNIR + ugriz, black diamonds) light curves for the sample of SNe Ib/c from SDSS. Discovery epochs are marked by red dashed lines, the last non-detections by dashed blue lines. Each pseudo-bolometric light curve has been fit with Eq. (1), and the best fit is shown by a solid blue line. The peak epoch is marked by a blue/black dashed-dotted line. Each bolometric light curve has been fit with the Arnett model (see Sect. 3.4.2) when the explosion date and the maximum epoch are known, and the best fit is shown by a black solid line. The epoch of the first spectrum is marked by a black segment. Blue, red, and magenta labels correspond to SNe Ib, Ic, and Ic-BL, respectively.
Current usage metrics show cumulative count of Article Views (full-text article views including HTML views, PDF and ePub downloads, according to the available data) and Abstracts Views on Vision4Press platform.
Data correspond to usage on the plateform after 2015. The current usage metrics is available 48-96 hours after online publication and is updated daily on week days.
Initial download of the metrics may take a while.