Fig. 12
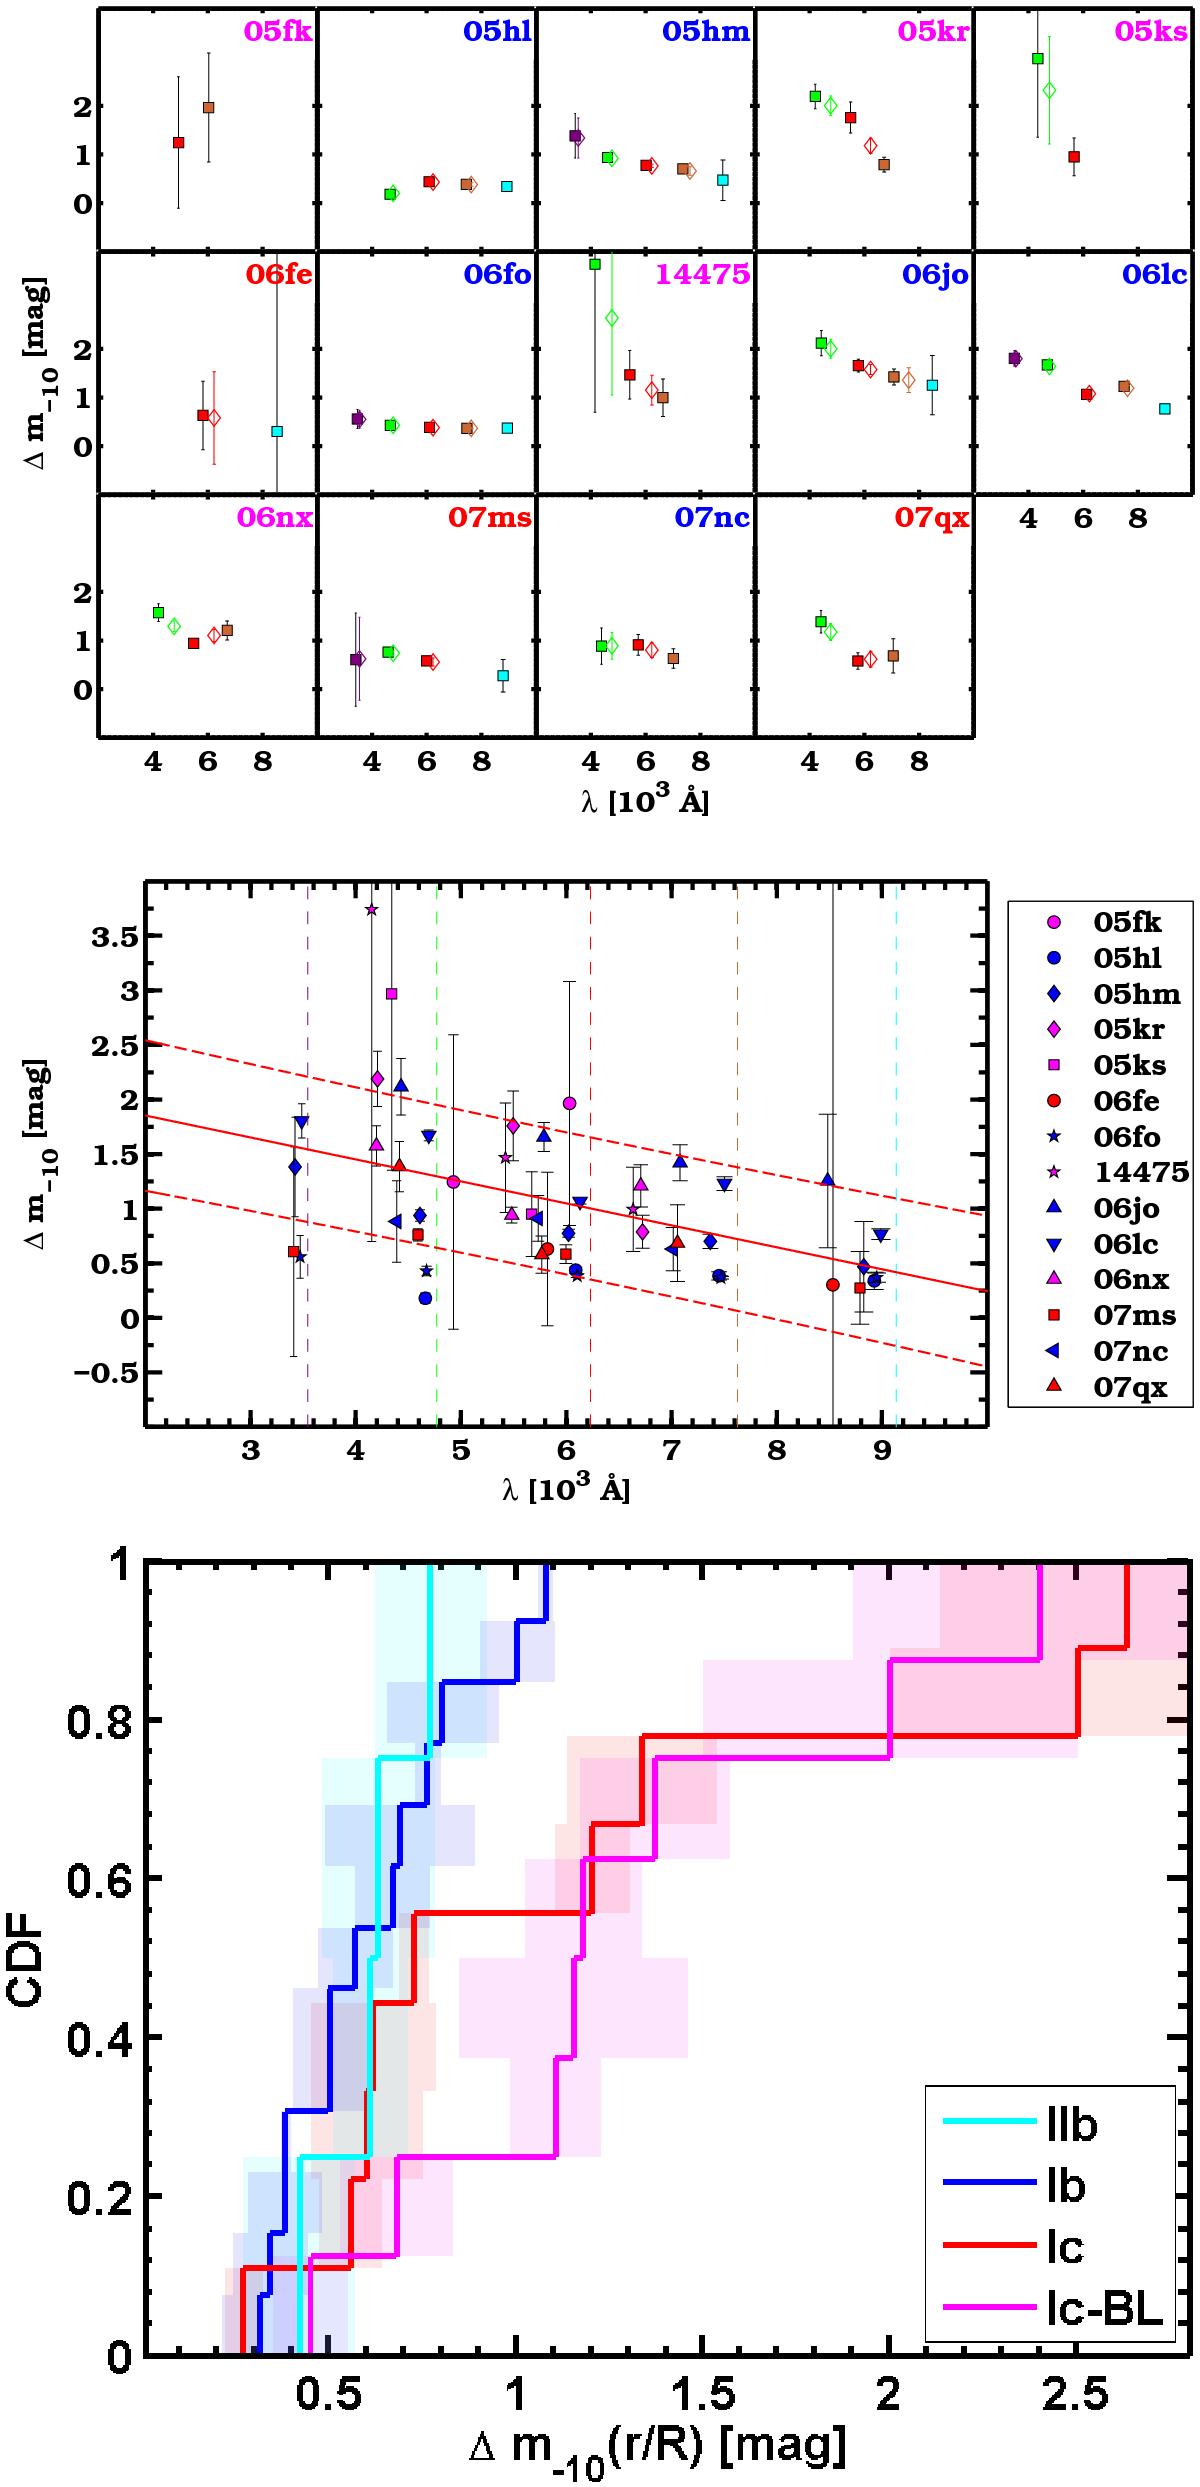
Top panel: Δm-10 for 14 SNe Ib/c in the SDSS sample as a function of the effective wavelength of each filter in the SN rest frame (violet, green, red, dark yellow and cyan represent ugriz filters). Bluer bands rise faster than redder bands for most of the objects. Blue, red and magenta labels correspond to SNe Ib, Ic and Ic-BL, respectively. Central panel: same as in the top panel, the line fitted to the data (and plotted in red) corresponds to Δm-10(λ) = −2.01 × 10⁻⁴λ + 2.26, with Δm-10 expressed in magnitudes and λ in Å. Uncertainties on Δm-10(λ) are ~0.66 mag. Bottom panel: cumulative distribution functions for the r-band Δm-10 of SNe IIb (4), Ib (13), Ic (9), and Ic-BL (8) from the SDSS sample and from the literature. Shaded areas indicate the uncertainties for Δm-10. SNe Ic and Ic-BL show higher values of Δm-10 when compared to SNe Ib (p-values =0.18 and 0.003, respectively).
Current usage metrics show cumulative count of Article Views (full-text article views including HTML views, PDF and ePub downloads, according to the available data) and Abstracts Views on Vision4Press platform.
Data correspond to usage on the plateform after 2015. The current usage metrics is available 48-96 hours after online publication and is updated daily on week days.
Initial download of the metrics may take a while.