| Issue |
A&A
Volume 573, January 2015
|
|
|---|---|---|
| Article Number | A52 | |
| Number of page(s) | 8 | |
| Section | Stellar structure and evolution | |
| DOI | https://doi.org/10.1051/0004-6361/201424877 | |
| Published online | 17 December 2014 | |
KIC 8302197: a non-rotating or low-inclination pulsating subdwarf B star observed with the Kepler spacecraft
1
Uniwersytet Pedagogiczny, Obserwatorium na Suhorze, ul. Podchorążych
2,
30-084
Kraków,
Poland
e-mail:
This email address is being protected from spambots. You need JavaScript enabled to view it.
2
Nordic Optical Telescope, Rambla José Ana Fernández Pérez
7, 38711
Breña Baja,
Spain
3
Instituut voor Sterrenkunde, KU Leuven, Celestijnenlaan
200D, 3001
Leuven,
Belgium
4
Dr. Remeis–Sternwarte, Institute for Astronomy,
University, Erlangen-Nürnberg,
Sternwartstr. 7, 96049
Bamberg,
Germany
Received: 28 August 2014
Accepted: 24 October 2014
Abstract
We present our analysis of Kepler data of a pulsating subdwarf B star, KIC 8302197. We used Q5-17 data and applied a Fourier technique to extract 30 significant pulsation modes. We searched for multiplets and period-spacing sequences to perform a mode identification and to derive a rotation period. To our surprise, KIC 8302197 does not show any multiplets. We explain the lack of multiplets by either a very slow rotation (longer than ~1000 days) or a unique (pole-on) orientation of the pulsation axis. Our mode identification relied solely on period spacing. We were successful in identifying modal degrees of most of the detected modes. An analysis of the period stability did not show any evidence of a companion to the host star. In addition to photometric data, several spectroscopic observations were collected. Our twelve radial-velocity measurements constrain a possible orbital radial-velocity amplitude to be smaller than about 10 km s-1. Furthermore, based on color indices we constrained a possible companion to be an M or later type main sequence, a compact or a substellar object. We found that the atmospheric parameters (Teff = 27 450 ± 200 K, log g = 5.438 ± 0.033 dex, and log (nHe /nH) = −2.56 ± 0.07 dex) of KIC 8302197 are consistent with other slow pulsating subdwarf B stars. From the optical spectra we derived C, N, O, Si and Fe abundances, and set an upper limit for the S abundance.
Key words: asteroseismology / stars: oscillations / subdwarfs / stars: abundances
© ESO, 2014
1. Introduction
Subdwarf B (sdB) stars are core-helium burning stars with remnant hydrogen envelopes located on the extended horizontal branch. Their masses are close to 0.5 solar mass, while their radii range from 0.15 to 0.35 solar radius. The effective temperatures range between 20 000 and 40 000 K.
Kilkenny et al. (1997, and their subsequent papers) presented discoveries of pulsating sdB stars (hereafter: sdBV). At first, most of sdBV stars were observed from the ground and more than 50 such objects have been found (see Table 9 of Østensen et al. 2010a). Another 19 new sdBV stars were observed with the Kepler spacecraft. Apart from ground-based observations, most of these objects were monitored for a few years. The entire sample of sdBV stars found in the Kepler field of view was presented in Østensen et al. (2010b, 2011). Preliminary analyses of those objects have been already published in a series of papers, while the analyses based on most of the collected data were published only for a few stars (Baran et al. 2012; Telting et al. 2012; Baran 2012; Reed et al. 2014; Østensen et al. 2014a,b; Telting et al. 2014b). Each sdBV star observed with the Kepler spacecraft shows features that are not detectable in ground-based data, e.g., lots of multiplets and their evolution with time, a beaming effect, and trapped modes.
The discovery of stellar oscillations in sdB stars has opened a way to study their interiors via asteroseismology. The periods detected in the data can be matched with those derived from the models to obtain the physical properties of the stars, such as mass, size, effective temperature, chemical abundance, the carbon core properties, and the mass of the hydrogen envelope. The more periods that are detected, the better the model constraint. Moreover, the mode identification, an assignment of radial order n and modal degree l, helps to decrease the number of free parameters in the modeling, making the application of asteroseismology more reliable. Therefore, mode identification is crucial in research on pulsating sdB stars.
In this paper we present our in-depth analysis of the Kepler light curve of KIC 8302197. Mode identification is the primary goal of this paper. We present this analysis in Sect. 6. In addition, we used other information pulled from the data to discuss binarity status, the star’s rotation, and the spatial orientation of its spin axis. This paper is another in the series presenting the comprehensive analysis based on all Kepler data available to us. This dataset is the best source of information about KIC 8302197 to date. Additionally, we obtained new low-resolution spectroscopy aiming to constrain the binary status and atmospheric parameters of KIC 8302197.
2. Data
KIC 8302197 was monitored by the Kepler spacecraft during Q3 (long cadence – LC) and Q3.3 (short cadence – SC). After it turned out that the star is a pulsator it was assigned an SC slot and data were continuously collected starting with Q5 (BJD = 2 455 276.48) until the moment of Kepler’s breakdown in Q17 (BJD = 2 456 424.01), with an unexpected gap during Q12. The results of the analysis of Q3.3 SC data were published by Baran et al. (2011). We did not include them in the current analysis of Q5 – 17 SC data since they cause the window function in the periodogram to be more complicated, while not lowering the mean noise level substantially. We used the result of Baran et al. (2011) mainly for comparison purposes to judge the stability of the pulsation modes.
We downloaded all data directly from the Barbara A. Mikulski Archive for Space Telescopes database. These data are given in FITS tables, and a few different fluxes are available: a flux from a customized aperture (FLUX), a flux from the optimal aperture (SAP), a detrended and de-contaminated flux (PDC) and a flux of the profile fitting (PSF). The FLUX requires an extensive and time-consuming analysis to choose the best apertures to preserve the signal from the target and to avoid unnecessary noise from either the contaminating stars or background. The SAP and PDC are easier to extract, however they are still suffering from onboard systematics. Unexpectedly, the PSF gives useful results considering that the square pixels are fairly big (4 arcsec). It uses a model of the pixel response function determined from a combination of Kepler optical point spread function (PSF) and various systematics of the spacecraft. If correctly applied, it helps to avoid contamination from the neighboring stars. In addition, for stars fainter than 14mag, it gives more precise photometry as compared to the aperture method. The drawback of PSF fluxes is that their extraction takes at least a few days to complete.
The data are in monthly chunks with strong systematics preventing easy and quick stitching, therefore the data have to be detrended. This is an important part of data processing since a detrending can easily remove a science signal from the data. The correct stitching of data between monthly downlinks requires elaborate methods along with human quality control and experience in Kepler data analysis. This step can be taken using co-trending vectors (FLUX, SAP, and PDC) and, if necessary, a cubic spline curve fitted to mean values calculated from 0.5-day bins (all cases). Finally, the fluxes were 4.5 – sigma clipped and converted to parts per thousand (ppt) units. For further analysis we adopted PSF fluxes since our data processing revealed that they are characterized by the lowest average noise level in the amplitude spectrum (details in Sect. 4).
In addition to photometry, spectroscopic observations were also done. The ultimate goal of these observations is to determine the binary status of sdBV stars observed with the Kepler spacecraft (Telting et al. 2014a). We obtained low-resolution spectra (R~ 2000−2500) using the 2.56-m Nordic Optical Telescope with ALFOSC, grism #16, and a 0.5 arcsec slit, as well as the 4.2-m William Herschel Telescope with ISIS, the R600B grating, and 1.0 arcsec slit. The exposure times were 900 s with the exception of one observation of 600 s at the NOT (BJD = 2 455 713.72439). The resulting resolutions based on the width of arc lines were 0.22 nm and 0.17 nm for the NOT and WHT setups, respectively. The ALFOSC at NOT spectra that were presented in recent papers as part of our campaign to unravel the binary status of the Kepler sdBV stars (Telting et al. 2014a) suffered from instrumental structure in the continuum level of a few percent or less. The origins of this are stray light in the blue part of the spectroscopic halogen flat fields and the subsequent inability to flat-field out the blue CCD etching pattern. For KIC 8302197 we used a novel flat-fielding procedure where the spectroscopic flat field is replaced by one constructed from ALFOSC imaging sky-flats in the UBV bands. For each CCD pixel along the dispersion that corresponds to a certain wavelength, the spectral flat-field is constructed from interpolating the normalized UBV imaging flats at that wavelength. The resulting average spectrum overlaps better with the WHT spectrum and has better signal-to-noise ratio (S/N), while the RV errors provided by IRAFs FXCOR are significantly decreased.
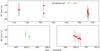 |
Fig. 1 Radial-velocity measurements for KIC 8302197. The red dots and green triangles represent NOT and WHT telescopes, respectively. |
Thus far, only 12 spectra of KIC 8302197 were taken to measure radial velocities, and no signatures of binarity have been found. The average radial velocity is −37.8 ± 2.1 km s-1, with a standard deviation of 7.3 km s-1 (Fig. 1). Our RV data are not sufficient to rule out the presence of a possible companion but constrain the orbital RV amplitude to about 10 km s-1 or less.
3. Model atmosphere analysis
KIC 8302197 was discovered by the Kepler compact-pulsator survey (Østensen et al. 2011), and its first classification spectrum was obtained with WHT/ISIS in the range λ=3100−5300 Å at R ≈ 1600. Østensen et al. (2011) derived Teff=26 400±300 K, surface gravity log g=5.32±0.04 dex, and He abundance log (nHe /nH)=−2.7±0.1 dex using the metal-line-blanketed local thermodynamic equilibrium (LTE) models of Heber et al. (2000).
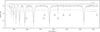 |
Fig. 2 Radial-velocity-corrected, combined WHT/NOT spectrum of KIC 8302197 (black). The S/N peak of the combined spectrum is ~150. The continuum of the normalized spectrum was sampled in 100 Å sections. The model fit computed with Tlusty/XTgrid and the fit residual (gray) are shifted vertically for clarity. Line identifications and equivalent widths in mÅ are only given for the strongest lines of the significant ions in the model. The atmospheric parameters of the model are given in Table 1. |
To further constrain the atmospheric parameters of KIC 8302197 and estimate its metal abundance, we analyzed all the new low-resolution WHT/ISIS and NOT/ALFOSC spectra with the Tlusty/Synspec non-LTE model atmosphere and spectral synthesis codes (Hubeny & Lanz 1995; Lanz & Hubeny 2003, 2007). Tlusty is perfectly suitable for working with sdB stars. It calculates fully line-blanketed, plane-parallel model atmospheres with opacity sampling and departures from LTE for a set of elements. We treated 14 elements in full non-LTE in both Tlusty and Synspec. Our models include the ions of H i, He i-ii, C i-v, N i-v, O i-v, Ne i-iv, Mg ii-iii, Al ii-iii, Si i-iv, P iv-v, S ii-vi, Ca i-iii, Fe ii-vi, and Ni iii-v, thereby providing 1294 energy levels in all. The remaining 16 elements were kept in LTE and these elements were assumed to not contribute to the opacity in the atmosphere structure calculation.
None of these elements were found to be significant in the spectra. To consider the model atmosphere structure and the lines visible in the observations simultaneously we included the first 30 elements in our synthetic spectra. The spectral analysis was performed with the steepest-descent, iterative spectral-analysis program XTgrid (Németh et al. 2012). By starting out from an approximate spectral model of an average sdB star XTgrid makes successive updates of the atmospheric parameters to fit the observations and minimize the global chi-squared. The procedure does not require a model grid, while new models are calculated on the fly in the direction of decreasing chi-squares. To accelerate the fitting procedure, the complexity of our models increases with the goodness of fit. Usually 30 to 50 iterations and some 120 models are required to converge the final model with 50 depth points and 0.1% relative change in the structural and atmospheric parameters. Statistical errors of the final parameters are evaluated by calculating new models in one dimension until the respective confidence limit is reached. The best fit is shown in Fig. 2, and the final parameters are listed in Table 1 with the error bars.
Parameters of the model shown in Fig. 2, with respect to the solar abundances from Asplund et al. (2009) provided for comparison.
To investigate instrumental effects we started the spectral analysis separately for the WHT and NOT datasets. In both cases and in every iteration the individual spectra were compared with the actual model and their chi-squared values were weighted by the S/N of the observation. The sum of these individual chi-squared values was minimized in the procedure. It turned out, however, that no systematic differences beyond the statistical errors are present between the WHT and NOT observations, so we decided to combine all 12 observations to increase the S/N to ~150 and fit as many weak lines as possible.
The pulsation properties of KIC 8302197 suggest that it must be a slow rotator or it is seen nearly pole-on. Therefore we assumed that rotational broadening is negligible in the spectra of the star. The final spectral model also confirms that no extra broadening is required to fit the Balmer lines and vrsini< 10 km s-1.
Metal absorption lines are weak in the optical spectra of hot stars and one must be particularly careful when deriving metal abundances from low S/N data, because some random noise features may coincide with metal lines. Global fitting procedures therefore need to relate the strongest lines that drive the fit to the error statistics of the observation to decide which abundances are significant. We applied a post-fit check and found that beyond the obviously strong lines of H and He, significant are also the strongest lines of C, N, O, Si and Fe. We can set a reasonable upper limit for S, while other elements cannot be seen in the spectrum. We cut the Ca ii H&K lines from the data because these lines also form in the interstellar medium so their strengths do not necessarily reflect the photospheric abundances. Line-blanketing means that Fe has a notable backwarming effect on the temperature structure of the atmosphere and therefore on the Balmer line profiles.
The fitting procedure provided slightly asymmetric error bars as listed in Table 1. Making these symmetric we found that KIC 8302197 has a non-LTE temperature of Teff = 27 450±200 K, surface gravity log g = 5.438±0.033 dex and He abundance log (nHe /nH) = −2.56±0.07 dex which places it clearly among most of the slow pulsating sdB stars. The metallicity of KIC 8302197 fits in the general abundance profiles of sdB stars (Geier 2013): helium and light metals are depleted, while Fe is near or somewhat above the solar abundance. The nuclear history of sdB stars is not reflected by their surface parameters, because diffusion processes change the surface abundances (Michaud et al. 2011). Therefore abundance ratios show large star-to-star scatter, and it is also not surprising that, while the absolute C and N abundances of KIC 8302197 are comparable to other slow pulsating sdB stars, its O abundance is relatively high. We found a N/O ratio of 0.27 in KIC 8302197 and 2.8 in the otherwise very similar slow pulsator KIC 7668647 (Telting et al. 2014b). Selective radiative acceleration processes acting on O ions are predicted by theory (Votruba et al. 2010).
Since our RV measurements are insufficient for conclusively constraining binarity, we must rely on the quality of the new combined spectrum of KIC 8302197. First, Deca et al. (2012) provide a correlation among visible, infrared color indices and the spectral contribution of main-sequence companions to sdB stars. We collected optical photometry from the Naval Observatory Merged Astrometric Dataset (NOMAD; Zacharias et al. 2004) and infrared photometry from the 2MASS All-Sky Catalog (Skrutskie et al. 2006), which gave B − V = −0.29 and J − K = 0.49. Based in Fig. 6 in Deca et al. (2012) these values suggest that any companion must have a spectral type later than M0. The predicted flux contribution is below 5% at 5000 Å, and therefore such a companion would not be visible in our spectrum.
The second method was a direct spectral decomposition. Disregarding the noise level of the spectrum we tried to cross-correlate all the weak ripples in the residuals with a cool star template. This procedure did not reveal any companion down to 2% flux level, and it confirms the conclusion of the first method. Németh et al. (2012) have successfully resolved sdB−G type binaries with ~35% flux contribution of the G type companion, therefore a possible main-sequence companion with less then 5% flux contribution must be a star that is later than K type.
Summarizing, based on optical-infrared color indices and the spectral quality, we conclude that any possible companion can only be an M dwarf or later, a compact (probably a white dwarf), or a substellar object. The lack of observed multiplets suggests a very low inclination that does not allow the mass of the companion to be estimated to further constrain its nature.
4. Amplitude spectrum
We used a Fourier technique to identify periods that exist in the photometric data. We calculated an amplitude spectrum and selected frequencies for a nonlinear least-squares fit. Each periodic signal was presented in the form Aisin(ωit + φi). This iterative process followed the standard prewhitening procedure and continued until all peaks with amplitudes above a threshold of S/N = 4 (0.027 ppt) had been removed. This detection threshold was adopted from Breger et al. (1993).
Baran et al. (2011) presented only eight periods detected in one month of survey data of KIC 8302197. Seven of them were found in the g-mode regime, while the eighth was associated with a p-mode. The residual amplitude spectrum did not show any significant leftovers suggestive of stable periods, phases and amplitudes over the course of the monitoring.
We show the amplitude spectrum calculated from Q5 – 17 data in Fig. 3. The frequency resolution is 0.0151 μHz, defined as 1.5 /T, where T is the time baseline of the data. In our analysis we detected 30 periods. We did not find any significant signal at very low frequencies. Such a signal is very often associated with the binary nature of a star (Baran & Winans 2012; Telting et al. 2012). All but two frequencies (f1 to f28) can be associated with g-modes, while two (f29, f30) are located in the intermediate region between g and p-modes. The amplitude spectrum is dominated by the frequency at ~187 μHz which falls close to the middle section of the bulk of the signal. Other periods have amplitudes smaller than 30% of the dominant one. We present the entire list of detected periods in Table 2. It should be noted that two frequencies, f9 and f10, were not fit, and their values are given without error estimates. The peaks are relatively high in amplitude, however we could not obtain a fit when they were added to our solution. Their frequencies and/or amplitudes are unstable so that the solution hardly fits.
We confirm seven periods in the g-mode region detected by Baran et al. (2011) while we did not find any significant signal in the p-mode region. The period of 6002.352 μHz could be transient or spurious in the survey data. Our set of periods was tested against the spurious signal listed in both Data Release Notes and Baran (2013) to avoid artifacts in our solution. Contrary to the stability of periods studied by Baran et al. (2011), after removal of the 28 signals from the data, the residual amplitude spectrum still contains significant power at most of the identified frequencies. This is caused by instability of the pulsation frequencies and/or amplitudes over three years.
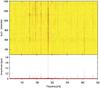 |
Fig. 3 Time frequency diagram of KIC 8302197, calculated from 30-day time chunks, to show instabilities of the detected modes (top panel) and a close-up of the amplitude spectrum of KIC 8302197 (bottom panel). |
The substantially larger sample of periods detected in Q5 – 17 data, as compared to just seven described by Baran et al. (2011), should significantly improve an application of asteroseismology since stellar interiors are better described if pulsators are multiperiodic.
5. Multiplets
Stellar rotation manifests itself in amplitude spectra by lifting the 2l + 1 degeneracy that creates evenly spaced (to first order) multiplets in the frequency domain. Recent results of analyses of sdBV stars observed with the Kepler spacecraft explained why the multiplets were not common in ground-based data. It is the relatively long stellar spin period, which requires long monitoring to resolve multiplets. Such monitoring was problematic from the ground, and only a handful of objects were given an opportunity to show their behaviors on long time scales (e.g., Baran et al. 2009). Kepler monitored objects for years. In the case of sdBV stars it allowed us to detect multiplets in several, (e.g., Baran et al. 2012; Telting et al. 2012; Baran 2012; Baran & Winans 2012; Reed et al. 2014). We have not detected any multiplets in KIC 8302197, even though the coverage is longer than three years. This null detection is bizarre since we expect that all stars rotate and this should create multiplets detectable in every amplitude spectrum (if data coverage is long enough). KIC 8302197 was observed long enough to expect multiplets in the amplitude spectrum, keeping in mind that the spin periods of other sdBV stars are weeks or months (Baran et al. 2012; Telting et al. 2012; Baran 2012; Baran & Winans 2012; Reed et al. 2014).
Frequency list as a result of our prewhitening process for KIC 8302197.
From a careful analysis of the width of many of the pulsation peaks in the amplitude spectrum, while comparing them to that of the window function, we find that the widths of the peaks are consistent with the length of the data coverage, and give no evidence of any unresolved multiplets. Some pulsation peaks are wider, which can be explained by the variable nature of these modes. We also calculated a time-frequency diagram based on 200-day data chunks. High-frequency resolution was needed to resolve any potential signal close to our identified frequencies. This signal could be transient and not seen in the amplitude spectrum calculated from the entire dataset. If the chunks used to calculate the diagram were too short to resolve close modes, i.e. components of multiplets, we would see beating of the amplitudes. However, no such beating was observed. The diagram confirms that no off-side components of any possible multiplets are detected in KIC 8302197.
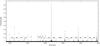 |
Fig. 4 Close-up of the amplitude spectrum of KIC 8302197 expressed in period instead of frequency to show l = 1 and 2 sequences. The three-digit numbers indicate period spacings between chosen periods. |
There are a few explanations for the lack of multiplets in the amplitude spectra. All of them are possible yet not all of them are equally likely. First, the rotation period is longer than the data coverage. This causes the components to remain unresolved in the amplitude spectrum. In contrast, as stated above, this case is unexpected since other sdBV stars rotate on timescales shorter than years. We do not expect that KIC 8302197 could slow down to longer than ~1000-day rate, unless there was/is an external force causing the star to lose its angular momentum; at present, we are not in possession of any observations of such a force.
Second, the off-side components are not driven by the driving mechanism. Selective driving causing only the central components to be driven is against our assumption that all m (azimuthal order) components are equally privileged. These scenarios both require special effects to explain our observations.
Third, the rotation axis, aligned with the pulsation axis, is pointed exactly at us. In this case only the central components of the multiplets are detectable, since the off-side components are geometrically cancelled out. Obviously, they would be detectable from other directions. A uniquely oriented rotation axis contrasts a little to the other two explanations. The spatial orientation is random and the probability that the axis points exactly at us is extremely small; for example, the chance of having an inclination angle below one degree is 0.015%. We know that a deviation from pole-on orientation will make a detection of the off-side components of the multiplets possible; however, the observable amplitudes will be affected by the driving mechanism as well. Therefore, the influence of the inclination on the amplitudes can only be modeled when assuming that the internal amplitudes of all components of the multiplets are equal. To constrain the rotation-axis inclination we followed that approach, while assuming that the surface-brightness variation of a pulsation mode can be modeled by a single spherical harmonic (using the model of Schrijvers & Telting 1999). Not-detecting the off-side components limits their amplitudes to 0.027 ppt. Comparing this value with the modeled relative amplitudes of the off-side components gives upper limits for an inclination of 2 and 7 degrees for l, |m| = 1, 1 and l, |m| = 2, 1, respectively. The limits were achieved for l = 1 and 2 modes with the highest amplitudes. The vsini for a rotation period at the upper limit of inclination would still be close to 0 km s-1. The probability of having an inclination smaller than 7 deg is 0.74%, so that such a low inclination is expected in several for every 1000 sdBs.
Despite a small chance of having such a unique orientation, this explanation, in contrast to the other two, does not require any special effect to play a role. It is only a unique orientation that has to be the case. We conclude that a very slow spin rate or a unique orientation are the most likely reasons for not detecting any off-side components of multiplets.
6. Period spacing
As shown in the case of sdBV stars (e.g., Baran 2012), the multiplets and asymptotic period spacing are very efficient tools for mode identification. Multiplets give the l and m values based on a number of components, while period spacing checks the separation between the same l overtones, which makes the identification cross-checked. Obviously, we cannot use multiplets, since we detected none, and the only tool for mode identification we can rely on is period spacing. The situation would be easier if the same modal degree sequences were complete. In case of missing components, particularly a few in a row, we may have doubts in the l assignment. These doubts are enhanced further by the crossing of the sequences of different l or significant mode trapping that is predicted by theoretical models.
To look for modes evenly spaced in period we used the period spacing ΔP≈ 250 s for the l = 1 sequence and ΔPl = 1/ for l = 2 derived in previous analyses of other sdBV stars observed with the Kepler spacecraft (Reed et al. 2010, 2011; Baran 2012; Baran & Winans 2012). This equal spacing is a consequence of an asymptote of high-order gravity modes (Charpinet et al. 2000).
The list of frequencies in KIC 8302197 is not long, yet we still found a patchy sequence of overtones with an average period spacing of 260 s, close to the expected value. Since we do not have multiplets to support our identification, at first, we accept that modal degree l = 1, if the period is close to its average spacing. This choice is supported by the fact that modes with lower degrees suffer less from a surface cancellation effect. Therefore, assuming equal intrinsic amplitudes of l = 1 and 2, lower degrees will have higher observable amplitudes. We present the result of our modal degree assignment in Fig. 4. Five periods outside the period range shown were not identified with modal degrees. They stand out from the bulk of periods and using them to complete the period sequences is ambiguous.
As a confirmation of the argument in the last paragraph, most of the l = 1 modes separated by ~260 s have high amplitudes. This is expected, and it was also noted for other Kepler sdBV stars analyzed thus far. Fourteen modes have been assigned l = 1 with high confidence. The individual period spacings of these modes deviate at most 20 s from the average value. Two additional modes (f5 and f11) may also be l = 1; however, the deviations from the average period spacing are significantly larger compared to the fourteen other modes. Their amplitudes are small and they also match l = 2 sequence.
To estimate the exact average spacing we selected fourteen certain l = 1 modes. We assigned an arbitrary radial order and fit a linear regression. We derived ΔPl = 1 = 258.61(62) s. This result is close, yet a little outside the errors, to the value obtained by Reed et al. (2011), who used one-month survey data with only nine periods detected.
The few modes identified as l = 2 do not allow us to estimate precisely the period spacing. The spacing between the consecutive components in the range of 4500 and 5000 s is close to the predicted value of 149.31 s. We assigned three more peaks with l = 2 only because their periods are too close to the already identified l = 1 modes and their amplitudes are small. The spacing between those three and the four certain l = 2 modes does not eliminate them from the l = 2 sequence.
Overall, we assigned modal degrees to 24 out of 30 periods. Paradoxically, the lack of multiplets comes to the aid of mode identification. If the multiplets are unresolved or we only detect the central components, we have no ambiguity in azimuthal order and the detected modes can be directly compared with the models. This result constitutes significant progress over the work of Reed et al. (2011) who analyzed the first weeks of Kepler data of KIC 8302197. Our mode identification will substantially decrease the number of free parameters making the modeling more reliable.
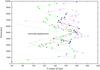 |
Fig. 5 Echelle diagram of identified l = 1 modes for seven sdBV stars with detailed analyses published thus far. Black filled circles – KIC 8302197; red open squares – KIC 2697388; red stars – KIC 11179657; green crosses – KIC 2991403; green filled squares – KIC 10553698; open blue circles – KIC 7668647; and blue filled triangles – KIC 11558725. The color-coded version is not available in the hard-copy version. |
In Fig. 5 we present an échelle diagram of dipole modes to study trapping properties of stars. We prepared it the same way as in Baran & Winans (2012), and for comparison, we overplotted the diagrams of other stars. In the case of no trapping inside a star, the diagram should show a vertical line that indicates that the period spacing is even and no chemical transition zones are present (see, e.g., Charpinet et al. 2000). On the other hand, if the diagram shows horizontal displacements, that indicates mode trapping. Based on seven stars in Fig. 5 we can see that all stars show such a displacement between 3000 and 7000 s and another one between 1000 and 3000 s, although the last only appears for KIC 10553698 since it has many short-period modes that have been identified. This indicates that mode trapping is present in these objects. However, the same location of the former hump of all stars in the diagram indicates no diversity of trapping properties as a function of effective temperatures and surface gravities (Table 3). If the trapping properties depended on temperature or gravity, we would expect that humps for the coolest/hottest or smallest/biggest stars would be organized according to their temperatures or sizes. All these stars, except KIC 2991403 in Fig. 5 are lined up and the period-sequence remainder (x-axis) coincides with the average period spacing of quadrupole modes in sdBV stars.
Basic parameters and period spacings of dipole modes of the stars included in the échelle diagram.
7. Period stability
Pulsation modes can be used to look for companions to the host stars. If a star is orbiting a companion the periods of the pulsation modes are modulated thanks to the Römer delay. To measure such modulation we sliced the data into bins of 91 days with two adjacent bins overlapping by 20%. This bin size was chosen to minimize uncertainties of the sinusoidal fit which was performed to derive the phase of a sinusoid. The period of the pulsation mode was kept fixed in each fit and adopted from the solution obtained from the analysis of all data. Then we calculated an observed minus calculated (O−C) diagram from the times of flux maxima to verify stability of the pulsation periods. A flat or sloped, yet linear shape indicates no period change, while a sinusoidal or parabolic one would be a sign of period change, either by a companion or evolution, respectively.
To obtain a reliable result we selected the f25 mode which does not show any significant residuals in the amplitude spectrum. All other modes with higher amplitudes left residuals after their removal, which means that the O−C is dominated by a beating between a peak and its residual. We present the amplitude and the O−C diagram of the f25 mode in Fig. 6. Since the amplitude of f25 is rather low, the errors of O−C are still high. This makes any small amplitude light-time effects (of seconds) impossible to detect in our diagram. This does not reject possible companions. However, the photometry data do not allow us to penetrate O−C on the scale of seconds, where small planets may exist. The O−C does not show any coherent periodic variation, therefore we assume the variation in O−C is caused by an instability in the mode itself.
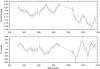 |
Fig. 6 O–C diagram to show period stability of f25 (3530.5486 s) |
8. Summary
KIC 8302197 is one of the 18 pulsating sdBV stars observed with the Kepler spacecraft. It is a g-mode pulsator with one of the sparsest amplitude spectra. We analyzed all post-survey photometric data and detected only 30 periods. Most of them are g-modes, and their typical amplitudes are below 0.05%. Only one mode’s amplitude reaches almost 0.1%. We found no multiplets, which is very surprising considering that multiplets are detected in all other Kepler sdBV stars analyzed thus far. This implies that the rotation period of KIC 8302197 could not be measured precisely. We explained this lack of multiplets by either a very slow rotation (longer than ~1000 days) or a unique (pole-on) orientation of the pulsation axis. Based on quadrupole modes the upper limit of the inclination reaches 7 degrees. Since we did not detect any off-side multiplet components, we interpreted all modes to be m = 0, which implies that they can be directly and unambiguously compared to the theoretical modes.
The number of detected modes was sufficient to identify sequences of l = 1 and 2 overtones. The derived average period spacing is 258.61 s and 149.31 s, respectively. We used those sequences to assign modal degrees to 24 out of 30 modes. The mode identification we performed will be invaluable for applying asteroseismology to infer physical parameters of KIC 8302197, particularly those impossible to achieve from other studies, such as carbon core properties, envelope helium abundance and hydrogen envelope mass. The échelle diagram of l = 1 modes shows a similar feature (a side hump) to a few previously studied sdBV stars. The hump is not exactly the same for all stars, which can be a reflection of different properties of each object and this could be a cue to look for a useful correlation between period spacings and some stellar parameters, excluding Teff and log g.
To look for a possible companion to our sdBV star, we used one carefully selected, relatively stable mode to calculate an O−C diagram and to look for variation in the pulsation period. To minimize the errors, we used data bins of 91 days. Unfortunately, the errors are still large, which implies that any definite conclusion on the binary status of KIC 8302197 is impossible to draw. In addition to the photometric data, twelve low-resolution spectra have been taken to look for radial-velocity variations. The measured radial velocities are consistent with a single star, and any radial-velocity amplitude over 10 km s-1 can be excluded. In case our conclusion of a unique pole-on orientation of the rotation axis is correct, then radial velocities of our sdB star caused by any companion in an orbit co-planar to the stellar equator would not be observable. Based on a flux contribution in the spectra, any possible companion can only be an M or later type main-sequence star, a compact (possibly a white dwarf) or a substellar object.
We found that the atmospheric parameters of KIC 8302197 are consistent with other slow pulsating sdB stars. The new parameters – Teff = 27 450±200 K, log g = 5.438±0.033 dex and log (nHe /nH) = −2.56±0.07 dex – are systematically higher than reported by Østensen et al. (2011); however, the differences are small if one considers that independent observations, models and methods were used in these analyses. We found the metal abundances are consistent with other sdB stars.
Acknowledgments
A.S.B., Sz.B. and J.K. gratefully acknowledge financial support from the Polish National Science Centre under project No. UMO-2011/03/D/ST9/01914. This work is also based on observations made with the Nordic Optical Telescope, operated on the island of La Palma jointly by Denmark, Finland, Iceland, Norway, and Sweden, with the Spanish Observatorio del Roque de los Muchachos (ORM) of the Instituto de Astrofisica de Canarias, and with the William Herschel Telescope also at ORM, operated by the Isaac Newton Group. We thank the entire Kepler team for the many years of work, which is proving so successful. The authors thank the referee C. S. Jeffrey for his suggestions that helped improve the paper.
References
- Asplund, M., Grevesse, N., Sauval, A., & Scott, P. 2009, ARA&A, 47, 481 [NASA ADS] [CrossRef] [Google Scholar]
- Baran, A. 2012, AcA, 62, 179 [NASA ADS] [Google Scholar]
- Baran, A. 2013, AcA, 63, 203 [Google Scholar]
- Baran, A., & Winans, A. 2012, AcA, 62, 343 [Google Scholar]
- Baran, A., Oreiro, R., Pigulski, A., et al. 2009, MNRAS, 392, 1092 [NASA ADS] [CrossRef] [Google Scholar]
- Baran, A., Kawaler, S., Reed, M., et al. 2011, MNRAS, 414, 2871 [NASA ADS] [CrossRef] [Google Scholar]
- Baran, A., Reed, M., Stello, D., et al. 2012, MNRAS, 424, 2686 [NASA ADS] [CrossRef] [Google Scholar]
- Breger, M., Stich, J., Garrido, R., et al. 1993, A&A, 271, 482 [NASA ADS] [Google Scholar]
- Charpinet, S., Fontaine, G., Brassard, P., & Dorman, B. 2000, ApJS, 131, 223 [Google Scholar]
- Deca, J., Marsh, T., Østensen, R., et al. 2012, MNRAS, 421, 2798 [NASA ADS] [CrossRef] [Google Scholar]
- Geier, S. 2013, A&A, 549, A110 [NASA ADS] [CrossRef] [EDP Sciences] [Google Scholar]
- Heber, U., Reid, I., & Werner, K. 2000, A&A, 363, 198 [NASA ADS] [Google Scholar]
- Hubeny, I., & Lanz, T. 1995, ApJ, 439, 875 [Google Scholar]
- Kilkenny, D., Koen, C., O’Donoghue, D., & Stobie, R. 1997, MNRAS, 285, 640 [Google Scholar]
- Lanz, T., & Hubeny, I. 2003, ApJS, 146, 417 [NASA ADS] [CrossRef] [Google Scholar]
- Lanz, T., & Hubeny, I. 2007, ApJS, 169, 83 [CrossRef] [Google Scholar]
- Michaud, G., Richer, J., & Richard, R. 2011, A&A, 529, A60 [NASA ADS] [CrossRef] [EDP Sciences] [Google Scholar]
- Németh, P., Kawka, A., & Vennes, S. 2012, MNRAS, 427, 2180 [NASA ADS] [CrossRef] [Google Scholar]
- Østensen, R., Oreiro, R., Solheim, J.-E., et al. 2010a, A&A, 513, A6 [NASA ADS] [CrossRef] [EDP Sciences] [Google Scholar]
- Østensen, R., Silvotti, R., Charpinet, S., et al. 2010b, MNRAS, 409, 1470 [NASA ADS] [CrossRef] [Google Scholar]
- Østensen, R., Silvotti, R., Charpinet, S., et al. 2011, MNRAS, 414, 2860 [NASA ADS] [CrossRef] [Google Scholar]
- Østensen, R., Reed, M., Baran, A., & Telting, J. 2014a, A&A, 564, A14 [NASA ADS] [CrossRef] [EDP Sciences] [Google Scholar]
- Østensen, R., Telting, J., Reed, M., et al. 2014b, A&A, 569, A15 [NASA ADS] [CrossRef] [EDP Sciences] [Google Scholar]
- Reed, M., Kawaler, S., Østensen, R., et al. 2010, MNRAS, 409, 1509 [NASA ADS] [CrossRef] [Google Scholar]
- Reed, M. D., Baran, A., Quint, A. C., et al. 2011, MNRAS, 414, 2885 [Google Scholar]
- Reed, M., Foster, H., Telting, J., et al. 2014, MNRAS, 440, 3809 [NASA ADS] [CrossRef] [Google Scholar]
- Schrijvers, C., & Telting, J. 1999, A&A, 342, 453 [NASA ADS] [Google Scholar]
- Skrutskie, M., Cutri, R., Stiening, R., et al. 2006, AJ, 131, 1163 [NASA ADS] [CrossRef] [Google Scholar]
- Telting, J., Østensen, R., Baran, A., et al. 2012, A&A, 544, A1 [NASA ADS] [CrossRef] [EDP Sciences] [Google Scholar]
- Telting, J., Østensen, R., Reed, M., et al. 2014a, in Hot Subdwarf Stars and Related Objects, eds. V. Van Grootel, B. Green, G. Fontaine, & S. Charpinet (ASP), ASP Conf. Ser., 481, 287 [Google Scholar]
- Telting, J., Baran, A., Németh, P., et al. 2014b, A&A, 570, A129 [NASA ADS] [CrossRef] [EDP Sciences] [Google Scholar]
- Votruba, V., Feldmeier, A., Krtička, J., & Kubát, J. 2010, Ap&SS, 329, 159 [NASA ADS] [CrossRef] [Google Scholar]
- Zacharias, N., Monet, D., Levine, S., et al. 2004, BAAS, 36, 1418 [Google Scholar]
All Tables
Parameters of the model shown in Fig. 2, with respect to the solar abundances from Asplund et al. (2009) provided for comparison.
Basic parameters and period spacings of dipole modes of the stars included in the échelle diagram.
All Figures
|
Fig. 1 Radial-velocity measurements for KIC 8302197. The red dots and green triangles represent NOT and WHT telescopes, respectively. |
| In the text | |
|
Fig. 2 Radial-velocity-corrected, combined WHT/NOT spectrum of KIC 8302197 (black). The S/N peak of the combined spectrum is ~150. The continuum of the normalized spectrum was sampled in 100 Å sections. The model fit computed with Tlusty/XTgrid and the fit residual (gray) are shifted vertically for clarity. Line identifications and equivalent widths in mÅ are only given for the strongest lines of the significant ions in the model. The atmospheric parameters of the model are given in Table 1. |
| In the text | |
|
Fig. 3 Time frequency diagram of KIC 8302197, calculated from 30-day time chunks, to show instabilities of the detected modes (top panel) and a close-up of the amplitude spectrum of KIC 8302197 (bottom panel). |
| In the text | |
|
Fig. 4 Close-up of the amplitude spectrum of KIC 8302197 expressed in period instead of frequency to show l = 1 and 2 sequences. The three-digit numbers indicate period spacings between chosen periods. |
| In the text | |
|
Fig. 5 Echelle diagram of identified l = 1 modes for seven sdBV stars with detailed analyses published thus far. Black filled circles – KIC 8302197; red open squares – KIC 2697388; red stars – KIC 11179657; green crosses – KIC 2991403; green filled squares – KIC 10553698; open blue circles – KIC 7668647; and blue filled triangles – KIC 11558725. The color-coded version is not available in the hard-copy version. |
| In the text | |
|
Fig. 6 O–C diagram to show period stability of f25 (3530.5486 s) |
| In the text | |
Current usage metrics show cumulative count of Article Views (full-text article views including HTML views, PDF and ePub downloads, according to the available data) and Abstracts Views on Vision4Press platform.
Data correspond to usage on the plateform after 2015. The current usage metrics is available 48-96 hours after online publication and is updated daily on week days.
Initial download of the metrics may take a while.