Free Access
Fig. 3
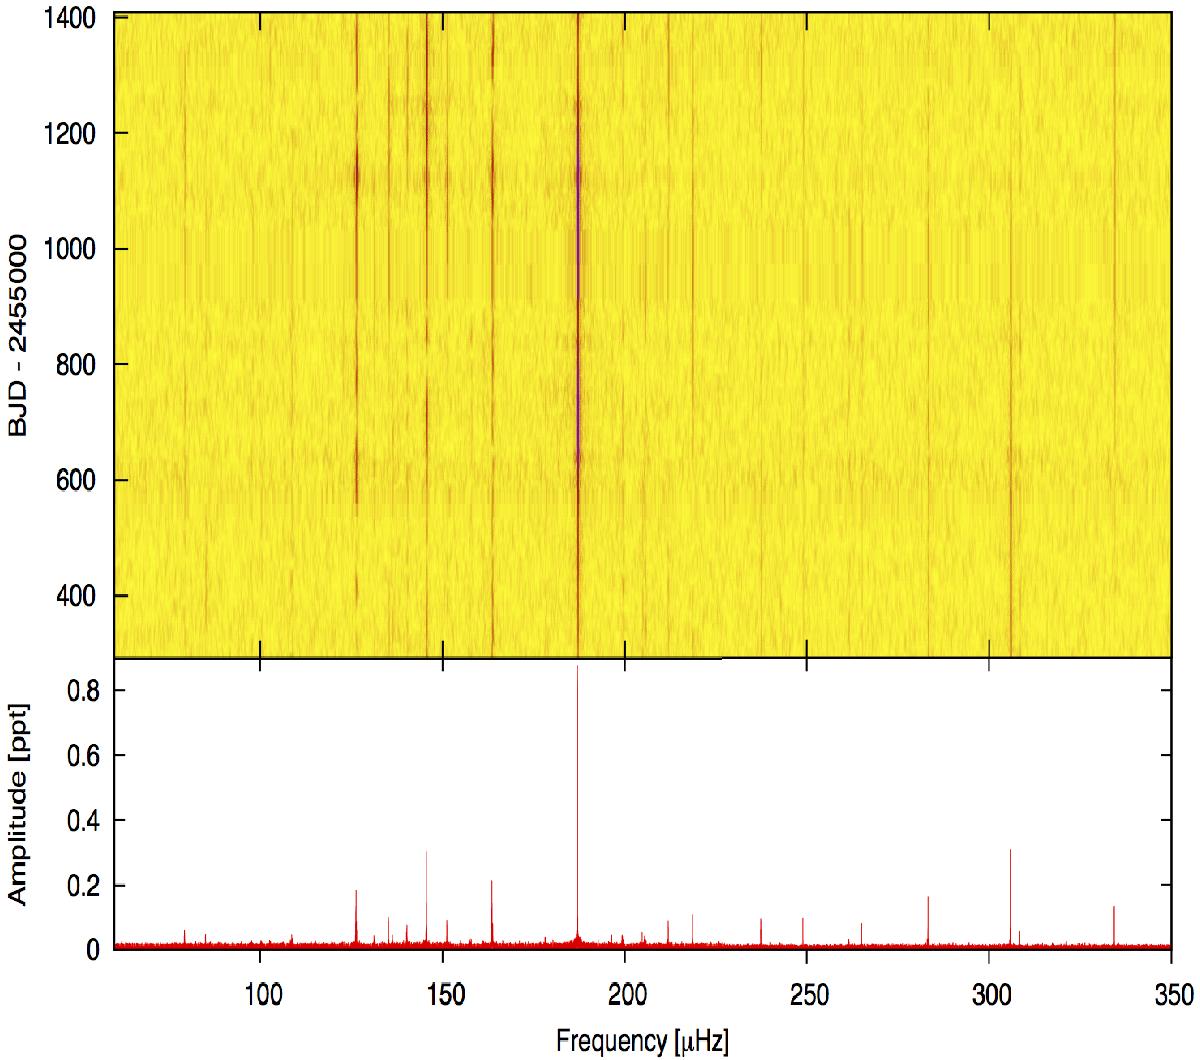
Time frequency diagram of KIC 8302197, calculated from 30-day time chunks, to show instabilities of the detected modes (top panel) and a close-up of the amplitude spectrum of KIC 8302197 (bottom panel).
Current usage metrics show cumulative count of Article Views (full-text article views including HTML views, PDF and ePub downloads, according to the available data) and Abstracts Views on Vision4Press platform.
Data correspond to usage on the plateform after 2015. The current usage metrics is available 48-96 hours after online publication and is updated daily on week days.
Initial download of the metrics may take a while.