| Issue |
A&A
Volume 573, January 2015
|
|
|---|---|---|
| Article Number | A96 | |
| Number of page(s) | 7 | |
| Section | Extragalactic astronomy | |
| DOI | https://doi.org/10.1051/0004-6361/201424870 | |
| Published online | 24 December 2014 | |
Comparing galaxy populations in compact and loose groups of galaxies
III. Effects of environment on star formation
1 Instituto de Astronomía Teórica y Experimental (IATE), CONICET, CCT Córdoba, Laprida 854, X5000BGR Córdoba, Argentina
2 Observatorio Astronómico, Universidad Nacional de Córdoba, Laprida 854, X5000BGR Córdoba, Argentina
e-mail: This email address is being protected from spambots. You need JavaScript enabled to view it.
Received: 27 August 2014
Accepted: 24 October 2014
Abstract
Aims. This paper is part of a series in which we systematically compare the properties of galaxies in compact groups, loose groups, and the field. In this paper we focus our study on the age and star formation in galaxies.
Methods. For galaxies in selected samples of compact groups, loose groups, and field galaxies, we compare the distributions of Dn(4000) as an age indicator and the specific star formation rate as an indicator of on-going star formation. We analyse the dependence of these parameters on galaxy type and stellar mass and, for group galaxies, their dependence on the dynamic state of the system. We study the relative fraction of galaxies dominated by old stellar populations as a function of galaxy stellar mass. We perform a similar analysis for galaxies that have high specific star formation rates.
Results. Galaxies in compact groups have, on average, older stellar populations than their loose-group or field counterparts. Early-type galaxies in compact groups formed their stars and depleted their gas content more rapidly than in the other environments. We have found evidence of two populations of late-type galaxies in dynamically old compact groups: one with normal specific star formation rates and another with markedly reduced star formation.
Conclusions. Processes that transform galaxies from star forming to quiescent act upon galaxies faster and more effectively in compact groups. The unique characteristics of compact groups make them an extreme environment for galaxies, where the transition to quiescence occurs rapidly.
Key words: Galaxy: evolution / Galaxy: fundamental parameters / Galaxy: general
© ESO, 2014
1. Introduction
One of the major challenges of modern astrophysics is to determine when and where stars form. The well known morphology-density relation (Oemler 1974; Dressler 1980) clearly indicates that the environment plays a fundamental role in the evolution of galaxies. Moreover, it has been suggested by Kauffmann et al. (2003a) that the galaxy property most sensitive to environment is the star formation rate by unit mass (specific star formation rate, SSFR). These authors find that galaxies with low stellar masses show a decrease in the SSFR by more than a factor of 10 from low to high density. This decrease is less marked for high-mass galaxies. Models of galaxy formation tend to reproduce the dependence of the star formation rate (SFR) with the local density; nevertheless, they fail to reproduce the fraction of quiescent galaxies. Hirschmann et al. (2014) find that models slightly under-estimate the quiescent fraction of central galaxies and significantly over-estimate that of satellite galaxies.
Although the local density can be a suitable way of representing the environment, similar values of local density can be found in regions with different physical conditions for both the dynamics of galaxies and the intergalactic medium. A good example of this situation are compact groups (CGs) and the core of rich clusters of galaxies. These two environments may have similar local density but very different velocity dispersions and gas temperatures. On the other hand, similar velocity dispersion can be found in environments with very different local densities, as is the case for CGs and loose groups (LGs). Therefore, the comparative study of the galaxy properties in different types of systems of galaxies has become a powerful tool for understanding the effects of the environment in galaxy evolution. These analyses have been benefited by large-scale galaxy surveys, such as the Sloan Digital Sky Survey (SDSS, York et al. 2000), that have allowed identifying thousands of groups, CGs, and clusters of galaxies.
In Coenda et al. (2012; hereafter Paper I) and Martínez et al. (2013; hereafter Paper II), we performed a detailed comparison of the properties of galaxies in compact and loose groups. In Paper I, we found that the fraction of red and early-type galaxies is larger in CGs. Our results suggest that galaxies in CGs are, on average, systematically smaller in size and more concentrated, and that they have higher surface brightness than galaxies in the field or in LGs. In Paper II we compared the properties of the brightest group galaxy (BCGs) and found that BCGs in CGs are brighter, more massive, larger, redder, and more frequently classified as elliptical. We concluded that galaxies inhabiting CGs have undergone a major transformation compared to galaxies that inhabit LGs.
Traces of the different paths in the evolution of galaxies can be found in terms of differences in the ages of the stellar populations. Proctor et al. (2004) and Mendes de Oliveira et al. (2005) compared the ages of galaxies in CGs and in other dense environments and found that galaxies in CGs tend to be older. The high density and low velocity dispersion in the CG environment set up the ideal conditions for gravitational interactions and, eventually, a favourable scenario for the truncation of the star formation. De la Rosa et al. (2007) find evidence of star formation quenching in low mass galaxies in CGs. These authors confirm that galaxies in CGs are older than in the field. Based on near- and mid-infrared imaging, Bitsakis et al. (2010) studied the SSFR in CGs, isolated galaxies, and interacting pairs and found no differences. However, for dynamically old systems, they find that late-type galaxies show slightly lower SSFR than in dynamically young CGs. They attribute this effect to the multiple past interactions among the galaxies in dynamically old groups. Similar results were found by Bitsakis et al. (2011), who performed a multi-wavelengh analysis from the ultraviolet to the infrared. Other peculiarities have been reported for galaxies in CGs. Tzanavaris et al. (2010) find a significant bimodality in the SSFR with a gap between low and high SSFR (see also Walker et al. 2012). These results are interpreted as further evidence that the high galaxy densities and low galaxy velocity dispersion play an important role in accelerating galaxy evolution by enhancing star formation and bringing on a fast transition to quiescence. Bimodal behaviour in SSFR has also been reported in LGs and clusters (Wetzel et al. 2012). The stellar populations of galaxies in CGs has also been studied using spectral synthesis analyses. Plauchu-Frayn et al. (2012) find that early-type galaxies are dominated by old and intermediate-age stellar populations. They also report that early-type spirals in CGs show lower SSFR values, while late-type spirals peak at higher values than do their counterparts in isolation, and support the scenario where galaxies in CGs have evolved more rapidly than isolated galaxies.
It has been suggested that the large scale structure can also affect the evolution of galaxies. Scudder et al. (2012) compared the galaxy properties in a sample of CGs that they split further by the large scale environment into isolated and embedded subsamples. They find that there is significant difference in SFRs of the star forming galaxies in CGs of isolated and embedded systems.
The galaxy properties in LGs have been extensively studied, and it has been shown that the group environment is also efficient in quenching the star formation (e.g. Martínez et al. 2002; Bai et al. 2010; Wetzel et al. 2012, 2013; McGee et al. 2011; Rasmussen et al. 2012). Wetzel et al. (2013) studied the quenching timescale of satellite galaxies and find that the SFR in groups evolve unaffected for 2−4 Gyr after the infall, and then the star formation quenches rapidly. Similar timescales have been estimated by McGee et al. (2011).
It becomes clear that both loose and compact groups are efficient at quenching the star formation in galaxies; nevertheless, it is not yet clear how the compactness differences moderate or increase the quenching process. As done in Papers I and II, we propose a systematic comparison between the properties of galaxies in compact and loose groups and field galaxies. In this paper we focus on the star formation rate and the age of galaxies. For this purpose we have used the MPA-JHU DR7 release of spectra measurements1. Using line fluxes, continuum indexes, line widths, etc., the MPA-JHU catalogue provides stellar masses (Kauffmann et al. 2003a), star formation rate (Brinchmann et al. 2004), and gas-phase metallicity (Tremonti et al. 2004) for the the main galaxy sample (MGS; Strauss et al. 2002) of the Seventh Data Release of the SDSS (DR7, Abazajian et al. 2009).
This paper is organised as follows. In Sect. 2 we describe the samples of groups and galaxies we used; in Sect. 3 we perform comparative studies of the galaxy populations in CGs, LGs, and the field; finally, our results are summarised and discussed in Sect. 4. Throughout the paper, a flat cosmological model is assumed with parameters Ω0 = 0.3, ΩΛ = 0.7, and a Hubble’s constant H0 = 100 h km s-1 Mpc-1. All magnitudes were corrected for Galactic extinction using the maps by Schlegel et al. (1998) and are in the AB system. Absolute magnitudes and galaxy colours were K-corrected using the method of Blanton et al. (2003; KCORRECT version 4.1). In this work, we select all groups in the A catalogue within the redshift range 0.06 ≤ z ≤ 0.18, which have spectroscopic redshift for at least one member galaxy that has a counterpart in MPA-JHU data set.
2. The samples
2.1. The sample of compact and loose groups
The samples of compact and loose groups of galaxies used in this paper have been constructed from the same group catalogues we used in Paper I and following the same selection criteria. The sample of compact groups is drawn from catalogue A of McConnachie et al. (2009), who used the original selection criteria of Hickson (1982) to identify compact groups in the sixth data release of the SDSS (Adelman-McCarthy et al. 2008). Catalogue A has 2297 groups, adding up to 9713 galaxies, down to a Petrosian (Petrosian 1976) limiting magnitude of r = 18, and it has spectroscopic information for 4131 galaxies (43% completeness).
This particular choice of redshifts was defined in Paper I, aiming at a fair comparison with two samples of loose groups of low and high mass, which we describe below. The number of low mass groups at higher redshifts rapidly drops and, conversely, so does the number of high mass groups at lower redshifts. We also restrict our analyses to galaxy members with apparent magnitudes 14.5 ≤ r ≤ 17.77, i.e., the range in which the MGS is complete. This results in a sample of 778 compact groups adding up to 978 galaxies.
The samples of loose groups are drawn from the sample of groups identified by Zandivarez & Martínez (2011; hereafter ZM11) in the MGS in SDSS DR7. They used a friends-of-friends algorithm (Huchra & Geller 1982) to link galaxies into groups, followed by a second identification using a higher density contrast in groups with at least ten members, in order to split merged systems and clean up any spurious member detection. The authors computed group virial masses from the virial radius of the systems and the velocity dispersion of member galaxies (Limber & Mathews 1960; Beers et al. 1990). The sample of ZM11 comprises 15 961 groups with more than four members, adding up to 103 342 galaxies. As in Paper I, we split the sample of loose groups into two subsamples of low, log (ℳvir/M⊙h-1) ≤ 13.2, and high, log (ℳvir/M⊙h-1) ≥ 13.6 virial mass. This choice excludes about 30% of the groups in ZM11, those of intermediate virial mass, which is within 0.2 dex of the median virial mass of the ZM11 catalogue at log (ℳvir/M⊙h-1) ~ 13.4. As in Paper I, to perform a fair comparison between the galaxies of CGs and LGs, we use a Monte Carlo algorithm to randomly select groups from these two subsamples. These new subsamples of low and high mass LGs have similar redshift distributions to that of the CGs. Our final subsamples of low and high mass LGs include 2319 and 2352 systems, adding up to 6996 and 7055 galaxies, respectively.
The samples of groups and galaxies used in this study are not exactly the same as in Paper I because here we restrict our analyses to galaxies that have data from the MPA-JHU DR7. This means that not all the galaxies we used in Paper I are included now, which in turn implies that about 9% of the compact groups in Paper I are now ruled out since they do not have a single galaxy with MPA-JHU DR7 data. The exclusion of these compact groups determines minor changes in the loose group samples, which are bound to have redshift distributions similar to that of the compact groups. We refer the reader to Paper I for further details.
2.2. The galaxy sample
The MPA-JHU data contains the derived galaxy properties from the emission line analysis for the DR7 of the SDSS. The catalogue provides stellar masses based on fits to the photometry following Kauffmann et al. (2003a) and Salim et al. (2007) and star formation rates based on Brinchmann et al. (2004) and gas phase metallicity following Tremonti et al. (2004). The MPA-JHU data is based on a re-analysis of the spectra so as to be more careful when extracting emission line fluxes than is done in the general purpose SDSS pipeline. The MPA-JHU also provides the index Dn(4000) based on the definition from Balogh et al. (1998). The Dn(4000) index is a good indicator of the stellar population age. For composite galaxies (up to 40 per cent of their Hα luminosity come from AGN), the MPA-JHU data use the Dn(4000) to estimate the SSFR. The parameters considered in our analysis are the stellar mass, the Dn(4000) index, and the SSFR. Average uncertainties in these quantities are: 0.13 dex, 0.5, and 0.5 dex, respectively.
As in Paper I, we compare the properties of galaxies in CGs and LGs with the properties of field galaxies. We consider as field galaxies to all DR7 MGS galaxies that have apparent magnitudes 14.5 ≤ r ≤ 17.77 and were not identified as belonging to LGs by ZM11 or to CGs by McConnachie et al. (2009). For an adequate comparison with our samples of galaxies in groups, we use the same Monte Carlo algorithm of the previous subsection to construct a sample of field galaxies that has a similar redshift distribution to galaxies in our CG sample. This field sample includes 200 102 galaxies.
3. Comparing properties of galaxies: stellar mass, specific star formation rate, and Dn(4000)
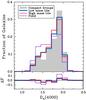 |
Fig. 1 Distributions of Dn(4000) parameter in our samples. CGs (grey shaded histograms), the field (violet dashed line), low-mass LGs (thick blue solid line) and high-mass LGs (red solid line). All distributions have been normalised to have the same area. In the panel below, we show the residuals between the distribution corresponding to galaxies in CGs and in the other environments. The binsize is 0.13. |
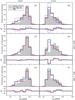 |
Fig. 2 Distributions of Dn(4000) parameter in our samples: left panels include early-type galaxies according to their concentration parameter, while right panels include late-type galaxies in our samples. Panels a) and b) show all galaxies in the samples, panels c) and d) galaxies in groups with ETF ≥ 70%, and panels f) and g) galaxies in groups with ETF < 70%. All distributions have been normalised to have the same area. Below each panel, we show the residuals between the CGs and the other distributions. The binsize is 0.14. Based on KS tests, we find there is no pair of them drawn from the same underlying distribution. Line types are as in Fig. 1. |
Analogously to Paper I, we classify galaxies into early and late types according to their concentration index. Typically, early-type galaxies have C ≥ 2.5, and for late-types C< 2.5 (Strateva et al. 2001). In this paper we compare properties of galaxies in samples drawn from an apparent magnitude-limited catalogue. Given a quantity bin, galaxies in it will have a range of absolute magnitudes and therefore a range of volume over which they could be detected in SDSS. To compensate for this, hereinafter we weight galaxy properties by using the 1 /Vmax method (Schmidt 1968), determining the maximum volume Vmax for which each galaxy could have been found.
We compare the normalised distributions of the stellar mass of galaxies in CGs and LGs, and find no differences, while field galaxies are somewhat less massive than galaxies in other environments. We do not attempt to analyse the distributions of the metallicity because only ~12% of galaxies in CGs have measured metallicity.
3.1. Environment vs. Dn(4000)
Figure 1 compares the normalised distributions of the Dn(4000) index for galaxies in CGs with LG and field galaxies. Below each panel of Fig. 1, we show the residuals between the distributions, i.e., for the property X and the difference ΔF(X) = fCG(X) − f(X), where fCG(X) and f(X) are the fractions of galaxies in the bin centred on X in the CGs and in the other sample, respectively. Kolmogorov-Smirnov tests (KS) confirm that, among the distributions shown, there is no pair of them drawn from the same underlying distribution. As can be seen from Fig. 1, the stellar populations in galaxies in CGs tend to be older than in field or LG galaxies. We find no difference between low or high mass LGs. CGs contain an excess of galaxies with Dn(4000) ≳ 1.75 and a deficit with Dn(4000) ≲ 1.75. The stellar populations in field galaxies are the youngest. Our results agree with the comparison of CGs and field galaxies by Proctor et al. (2004), Mendes de Oliveira et al. (2005), and de la Rosa et al. (2007).
We compare in Fig. 2 the normalised distributions of the Dn(4000) index of late (right panels) and early-type galaxies (left panels). In this figure, we also analyse separately groups with a large (≥70%) fraction of early-type galaxies (ETF) (central panels), and groups with a lower ETF (bottom panels). As pointed out by Bitsakis et al. (2010), if a group is dominated by early-type galaxies, it is more likely to be dynamically old, because interactions and mergers have had to occur in order to produce those galaxies. Conversely, groups not dominated by early types could be considered as dynamically young since some of their galaxies may have been gravitationally interacting for the first time. Thus, we use the ETF as an indication of group age. In the computation of the ETF, we use all galaxies available in the CG catalogue, not only those that have spectroscopic data. In all panels of Fig. 2, it is clear that both early- and late-type galaxies in CGs tend to have older stellar populations than in the other environments. The most significant result from this figure is that when we consider groups with large ETF, the stellar populations in early-type galaxies in both CGs and LGs have similar ages (panel (c)), on the one hand, and on the other, the stellar populations in late-type galaxies in CGs are on average much older than in LGs (panel (d)). This agrees with previous findings such as Bitsakis et al. (2010, 2011).
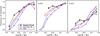 |
Fig. 3 Fraction of old stellar populations (Dn(4000) ≥ 1.6) as a function of the stellar mass. Vertical error bars are obtained by using the bootstrap resampling technique. Filled black circles and dotted lines represent the galaxies in CGs, low-mass LGs objects are shown as filled squares and solid blue lines; high mass LGs sample are shown as filled triangles and solid red lines. Galaxies in the field are represented as filled diamonds and solid violet lines. The left panel considers the whole sample, central panel the early-type galaxies, and right panel late types. The binsizes in stellar mass are 0.5 dex for LGs, 0.4 dex for CGs, and 0.3 dex for the field. Abscissas are the medians of the mass within each bin. Bins with fewer than 10 galaxies were excluded. |
Given that galaxy properties strongly depend on stellar mass (Kauffmann et al. 2003b), we explore the dependence of the Dn(4000) on stellar mass. The lefthand panel of Fig. 3 shows the fraction of galaxies with Dn(4000) ≥ 1.6 as a function of stellar mass, and the central and righthand panels show the corresponding fractions for early- and late-type galaxies, respectively. We use the criteria of Tinker et al. (2011) to separate between galaxies with old and young stellar populations. In particular, galaxies with Dn(4000) ≥ 1.6 have old stellar populations. This criteria has been used by other authors (Geha et al. 2012; Krause et al. 2013).
Over the whole range of stellar mass, the fraction of galaxies with old stellar populations increases with mass and is larger, moving from the field to massive LGs. Galaxies in CGs, however, show differences. For stellar masses below log (M∗/M⊙) ~ 10.5, their stellar populations are the oldest irrespective of their type. On the other hand, for higher stellar masses, the CG environment can not be distinguished from LGs whether we consider all galaxies or just the early types. The fraction of late types with old stellar populations is consistent with field values, or it is marginally smaller, for masses log (M∗/M⊙) ≳ 10.8. This could be an indication that a large fraction of massive late-type galaxies in CGs have undergone important episodes of relatively recent star formation.
3.2. Environment vs. SSFR
Figure 4 shows the distributions of the SSFR for our different samples of galaxies. SSFR values show a clear bimodality, more markedly on LGs but still present in the field and in CGs. Clearly, the population of field galaxies is dominated by galaxies with log (SSFR/ yr-1) > − 11, and the opposite is seen in CGs. LGs show an intermediate behaviour and a more clear bimodality (e.g. Wetzel et al. 2012).
In Fig. 5 we split the galaxy samples into early and late types and also distinguish whether the galaxies inhabit groups with ETF ≥ 70% or less. As expected, the bimodality seen in Fig. 4 can be explained in terms of early and late-type galaxies. It is also clear that both early and late types in CGs have lower values of SSFR compared to LG and even lower when compared to field galaxies. Of particular interest is panel (d), where we find a marked bimodality in the SSFR of late-type galaxies in CGs with ETF ≥ 70%, i.e., two populations of late-type galaxies similar in numbers, one with “normal” star formation and another with quenched star formation, both of them inhabiting old CGs. A bimodality in the distribution of the SSFR in CGs galaxies has been reported previously by Johnson et al. (2007), Tzanavaris et al. (2010), Walker et al. (2012), and Bitsakis et al. (2010, 2011).
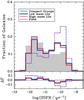 |
Fig. 4 Distributions of the SSFR in our samples. All distributions have been normalised to have the same area. Below each panel we show the residuals between the CGs and the other distributions. KS tests confirm that there is no pair of them drawn from the same underlying distribution. The binsize is 0.37. Colours and line types as in Fig. 1. |
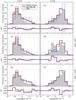 |
Fig. 5 Distributions of the specific star formation rate (SSFR) for early and late-type galaxies, with panels as in Fig. 2. All distributions have been normalised to have the same area. Below each panel we show the residuals between the CG’s and the other distributions. The binsize is 0.37. KS tests confirm that there is no pair of them drawn from the same underlying distribution. Colours and line types as in Fig. 1. |
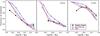 |
Fig. 6 Fraction of star-forming galaxies according to their SSFR (log (SSFR) ≥ − 11) as a function of the stellar mass. Vertical error bars are obtained by using the bootstrap resampling technique. Left panel considers the whole samples of galaxies, central panel the early-type galaxies, and the right panel late types. The bin sizes in stellar mass are 0.5 dex for LGs, 0.4 dex for CGs, and 0.3 dex for the field. Abscissas are the medians of the mass within each bin. Bins with less than 10 galaxies were excluded. Symbols and lines types as in Fig. 3. |
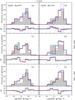 |
Fig. 7 Distributions of the SSFR of late-type galaxies for log (M∗/M⊙) ≥ 10.5 (left panels) and for log (M∗/M⊙) < 10.5 (right panels). All distributions have been normalised to have the same area. Below each panel, we show the residuals between the CGs and the other distributions. The binsize is 0.37. KS tests confirm that there is no pair of them drawn from the same underlying distribution. However, the distributions between low and high mass LG samples in panels a) and c) are the same above 50%. Colours and line types as in Fig. 1. |
We further explore the SSFR of galaxies in Fig. 6, where we show the fraction of galaxies with high SSFR (log (SSFR/ yr-1) ≥ − 11) as a function of stellar mass. Field and LG galaxies have smooth, featureless, decreasing trends with stellar mass over the whole mass range. At fixed mass, the fraction of star-forming galaxies is larger in the field, followed by low mass LGs and high mass LGs. For masses below log (M∗/M⊙) ~ 10.5, the fraction of star forming galaxies is lower for CGs than in the other environments (left panel). This is also true for late-type galaxies (right panel). For higher masses, CGs are not distinguishable from LGs, considering the whole population or just the early types (central panel). This is not the case, however, for the fraction of star-forming late types. It is consistent with, though even marginally higher than, the field value. All trends observed in this figure are in agreement with Fig. 3.
In the light of Figs. 5 (panel (d)) and 6, we explore the SSFR of late-type galaxies further in Fig. 7. There we split galaxies not only by whether they are in large ETF groups but also whether they are galaxies with log (M∗/M⊙) ≥ 10.5 or lower. The strong gap in the SSFR is seen only in CGs and is clearly present in galaxies inhabiting large ETF groups for both stellar mass ranges. The gap is particularly strong for massive late type galaxies. This further suggests that the high-density, low-velocity dispersion environment of CGs has accelerated the transition of galaxies from star-forming to quiescent. Similar results have been reported by Tzanavaris et al. (2010) and Plauchu-Frayn et al. (2012).
4. Conclusions and discussion
We have studied the specific SFR and ages of galaxies in compact and loose groups and in the field in the redshift range 0.06 <z< 0.18. We selected samples of galaxies in CGs drawn from McConnachie et al. (2009) and in LGs taken from ZM11. We constructed two samples of LG: low (log (ℳvir/M⊙h-1) ≤ 13.2) and high (log (ℳvir/M⊙h-1) ≥ 13.6) virial mass, both samples bound to have similar redshift distributions to the CG sample. Similarly, our sample of field galaxies was drawn to reproduce the redshift distribution of CGs. Galaxy properties used in our work were taken from the MGS sample of the SDSS DR7 and the MPA-JHU DR7 release. The final samples have 748, 2319, and 2352 of compact, low-mass, and high-mass loose groups, respectively. The corresponding number of member galaxies are: 978, 6996, and 7055. The field sample comprises 200 102 galaxies.
We classified galaxies into early and late types according to their concentration index. Following Bitsakis et al. (2011), we distinguished groups of galaxies as dynamically old or dynamically young. A group is classified as dynamically old if more
than 70% of its galaxies are early types, or as dynamically young if otherwise. We found that the stellar populations in galaxies in CGs are, on average, older than in LGs or in the field. This agrees with Proctor et al. (2004), Mendes de Oliveira et al. (2005), de la Rosa et al. (2007), and Plauchu-Frayn et al. (2012). The stellar populations in late-type galaxies in CGs are, on average, much older than in LGs. This agrees with Bitsakis et al. (2010, 2011). For stellar masses log (M∗/M⊙) ≲ 10.5, both the stellar populations of early and late types in CGs are older than in the other environments. For higher stellar masses, in early types in CGs the stellar populations have ages similar to their LGs counterparts and, in late-types in CGs, are similar in age to field galaxies, or even younger.
The distribution of SSFR is clearly bimodal, more markedly in LGs but still present in CGs and in the field. This bimodality has been reported in LGs by Wetzel et al. (2012) and by Johnson et al. (2007), Tzanavaris et al. (2010), Bitsakis et al. (2010, 2011), and Walker et al. (2012) in CGs. The bimodal distribution can be explained in terms of two galaxy populations: early and late types.
Early- and late-type galaxies in CGs have, on average, lower SSFR values than in LGs and the field. For log (M∗/M⊙) ≲ 10.5 and irrespective of galaxy type, CGs have the lowest fraction of star-forming galaxies. For higher masses, the fraction of star-forming early-types in CGs is comparable to LGs, and the fraction of star forming late types in CGs is consistent with, or even higher than, in the field. The distribution of SSFR for late-type galaxies in CGs shows a bimodality, with a strong gap for dynamically old groups. No such gap is found in any of the other environments.
Our findings suggest that, compared to the other environments, early-type galaxies in CGs have formed their stars and depleted their gas content more rapidly. This is an indication that these galaxies have had more frequent mergers and multiple past interactions, which is something expected within an environment characterised by its high density and its low velocity dispersion.
For late-type galaxies in dynamically old CGs, we have found evidence of two populations of galaxies regarding their SSFR. One population of late types have “normal” SSFR, and they are forming stars, while the other population shows lower values of SSFR. Star forming late types in CGs may be recent acquisitions. By falling into CGs, these galaxies increase their
star formation and rapidly consume their gas. Further gas depletion and subsequent star formation quenching may be accounted for through merger events.
It is well known that groups of galaxies play a central role in accelerating galaxy evolution by enhancing the star formation process and leading a transition to quiescence. The results of this series of papers, point out to that compact groups are much more efficient than loose groups in transforming galaxies. It is clear that the unique characteristics of compact groups, namely, their high spatial density and low velocity dispersion, make them one of the most extreme environments for galaxies, an environment where the transition from star formation to quiescence takes place on particularly short time scales.
Acknowledgments
This work was supported with grants from CONICET (PIP 11220080102603 and 11220100100336) and SECYT-UNC, Argentina. Funding for the Sloan Digital Sky Survey (SDSS) has been provided by the Alfred P. Sloan Foundation, the Participating Institutions, the National Aeronautics and Space Administration, the National Science Foundation, the US Department of Energy, the Japanese Monbukagakusho, and the Max Planck Society. The SDSS Web site is http://www.sdss.org/. The SDSS is managed by the Astrophysical Research Consortium (ARC) for the Participating Institutions. The Participating Institutions are The University of Chicago, Fermilab, the Institute for Advanced Study, the Japan Participation Group, The Johns Hopkins University, the Korean Scientist Group, Los Alamos National Laboratory, the Max Planck Institut für Astronomie (MPIA), the Max Planck Institut für Astrophysik (MPA), New Mexico State University, University of Pittsburgh, University of Portsmouth, Princeton University, the United States Naval Observatory, and the University of Washington.
References
- Abazajian, K. N., Adelman-McCarthy, J. K., Agüeros, M. A., et al. 2009, ApJS, 182, 543 [NASA ADS] [CrossRef] [Google Scholar]
- Adelman-McCarthy, J. K., Agüeros, M. A., Allam, S. S., et al. 2008, ApJS, 175, 297 [NASA ADS] [CrossRef] [Google Scholar]
- Bai, L., Rasmussen, J., Mulchaey, J. S., et al. 2010, ApJ, 713, 637 [NASA ADS] [CrossRef] [Google Scholar]
- Balogh, M. L., Schade, D., Morris, S. L., et al. 1998, ApJ, 504, L75 [Google Scholar]
- Beers, T. C., Flynn, K., & Gebhardt, K. 1990, AJ, 100, 32 [NASA ADS] [CrossRef] [Google Scholar]
- Bitsakis, T., Charmandaris, V., Le Floc’h, E., et al. 2010, A&A, 517, A75 [NASA ADS] [CrossRef] [EDP Sciences] [Google Scholar]
- Bitsakis, T., Charmandaris, V., da Cunha, E., et al. 2011, A&A, 533, A142 [NASA ADS] [CrossRef] [EDP Sciences] [Google Scholar]
- Blanton, M. R., Brinkmann, J., Csabai, I., et al. 2003, AJ, 125, 2348 [NASA ADS] [CrossRef] [Google Scholar]
- Brinchmann, J., Charlot, S., White, S. D. M., et al. 2004, MNRAS, 351, 1151 [NASA ADS] [CrossRef] [Google Scholar]
- Coenda, V., Muriel, H., & Martínez, H. J. 2012, A&A, 543, A119 [NASA ADS] [CrossRef] [EDP Sciences] [Google Scholar]
- de la Rosa, I. G., de Carvalho, R. R., Vazdekis, A., & Barbuy, B. 2007, AJ, 133, 330 [NASA ADS] [CrossRef] [Google Scholar]
- Dressler, A. 1980, ApJS, 42, 565 [NASA ADS] [CrossRef] [Google Scholar]
- Geha, M., Blanton, M. R., Yan, R., & Tinker, J. L. 2012, ApJ, 757, 85 [NASA ADS] [CrossRef] [Google Scholar]
- Hickson, P. 1982, ApJ, 255, 382 [NASA ADS] [CrossRef] [Google Scholar]
- Hirschmann, M., De Lucia, G., Wilman, D., et al. 2014, MNRAS, 444 2938 [Google Scholar]
- Huchra, J. P., & Geller, M. J. 1982, ApJ, 257, 423 [NASA ADS] [CrossRef] [Google Scholar]
- Johnson, K. E., Hibbard, J. E., Gallagher, S. C., et al. 2007, AJ, 134, 1522 [NASA ADS] [CrossRef] [Google Scholar]
- Kauffmann, G., Heckman, T. M., White, S. D. M., et al. 2003a, MNRAS, 341, 33 [NASA ADS] [CrossRef] [Google Scholar]
- Kauffmann, G., Heckman, T. M., White, S. D. M., et al. 2003b, MNRAS, 341, 54 [Google Scholar]
- Krause, E., Hirata, C. M., Martin, C., Neill, J. D., & Wyder, T. K. 2013, MNRAS, 428, 2548 [NASA ADS] [CrossRef] [Google Scholar]
- Limber, D. N., & Mathews, W. G. 1960, ApJ, 132, 286 [NASA ADS] [CrossRef] [Google Scholar]
- Martínez, H. J., Zandivarez, A., Domínguez, M., Merchán, M. E., & Lambas, D. G. 2002, MNRAS, 333, L31 [NASA ADS] [CrossRef] [Google Scholar]
- Martínez, H. J., Coenda, V., & Muriel, H. 2013, A&A, 557, A61 [NASA ADS] [CrossRef] [EDP Sciences] [Google Scholar]
- McConnachie, A. W., Patton, D. R., Ellison, S. L., & Simard, L. 2009, MNRAS, 395, 255 [NASA ADS] [CrossRef] [Google Scholar]
- McGee, S. L., Balogh, M. L., Wilman, D. J., et al. 2011, MNRAS, 413, 996 [NASA ADS] [CrossRef] [Google Scholar]
- Mendes de Oliveira, C., Coelho, P., González, J. J., & Barbuy, B. 2005, AJ, 130, 55 [NASA ADS] [CrossRef] [Google Scholar]
- Oemler, A. J. 1974, ApJ, 194, 1 [NASA ADS] [CrossRef] [Google Scholar]
- Petrosian, V. 1976, ApJL, 209, L1 [NASA ADS] [CrossRef] [Google Scholar]
- Plauchu-Frayn, I., Del Olmo, A., Coziol, R., & Torres-Papaqui, J. P. 2012, A&A, 546, A48 [NASA ADS] [CrossRef] [EDP Sciences] [Google Scholar]
- Proctor, R. N., Forbes, D. A., Hau, G. K. T., et al. 2004, MNRAS, 349, 1381 [NASA ADS] [CrossRef] [Google Scholar]
- Rasmussen, J., Mulchaey, J. S., Bai, L., et al. 2012, ApJ, 757, 122 [NASA ADS] [CrossRef] [Google Scholar]
- Salim, S., Rich, R. M., Charlot, S., et al. 2007, ApJS, 173, 267 [NASA ADS] [CrossRef] [Google Scholar]
- Schlegel, D. J., Finkbeiner, D. P., & Davis, M. 1998, ApJ, 500, 525 [NASA ADS] [CrossRef] [Google Scholar]
- Schmidt, M. 1968, ApJ, 151, 393 [NASA ADS] [CrossRef] [Google Scholar]
- Scudder, J. M., Ellison, S. L., & Mendel, J. T. 2012, MNRAS, 423, 2690 [NASA ADS] [CrossRef] [Google Scholar]
- Strateva, I., Ivezić, Ž., Knapp, G. R., et al. 2001, AJ, 122, 1861 [Google Scholar]
- Strauss, M. A., Weinberg, D. H., Lupton, R. H., et al. 2002, AJ, 124, 1810 [NASA ADS] [CrossRef] [Google Scholar]
- Tinker, J., Wetzel, A., & Conroy, C. 2011, MNRAS, submitted [arXiv:1107.5046], [Google Scholar]
- Tremonti, C. A., Heckman, T. M., Kauffmann, G., et al. 2004, ApJ, 613, 898 [NASA ADS] [CrossRef] [Google Scholar]
- Tzanavaris, P., Hornschemeier, A. E., Gallagher, S. C., et al. 2010, ApJ, 716, 556 [NASA ADS] [CrossRef] [Google Scholar]
- Walker, L. M., Johnson, K. E., Gallagher, S. C., et al. 2012, AJ, 143, 69 [NASA ADS] [CrossRef] [Google Scholar]
- Wetzel, A. R., Tinker, J. L., & Conroy, C. 2012, MNRAS, 424, 232 [NASA ADS] [CrossRef] [Google Scholar]
- Wetzel, A. R., Tinker, J. L., Conroy, C., & van den Bosch, F. C. 2013, MNRAS, 432, 336 [NASA ADS] [CrossRef] [Google Scholar]
- York, D. G., Anderson, Jr., J. E., Anderson, S. F., et al. 2000, AJ, 120, 1579 [Google Scholar]
- Zandivarez, A., & Martínez, H. J. 2011, MNRAS, 415, 2553 [NASA ADS] [CrossRef] [Google Scholar]
All Figures
|
Fig. 1 Distributions of Dn(4000) parameter in our samples. CGs (grey shaded histograms), the field (violet dashed line), low-mass LGs (thick blue solid line) and high-mass LGs (red solid line). All distributions have been normalised to have the same area. In the panel below, we show the residuals between the distribution corresponding to galaxies in CGs and in the other environments. The binsize is 0.13. |
| In the text | |
|
Fig. 2 Distributions of Dn(4000) parameter in our samples: left panels include early-type galaxies according to their concentration parameter, while right panels include late-type galaxies in our samples. Panels a) and b) show all galaxies in the samples, panels c) and d) galaxies in groups with ETF ≥ 70%, and panels f) and g) galaxies in groups with ETF < 70%. All distributions have been normalised to have the same area. Below each panel, we show the residuals between the CGs and the other distributions. The binsize is 0.14. Based on KS tests, we find there is no pair of them drawn from the same underlying distribution. Line types are as in Fig. 1. |
| In the text | |
|
Fig. 3 Fraction of old stellar populations (Dn(4000) ≥ 1.6) as a function of the stellar mass. Vertical error bars are obtained by using the bootstrap resampling technique. Filled black circles and dotted lines represent the galaxies in CGs, low-mass LGs objects are shown as filled squares and solid blue lines; high mass LGs sample are shown as filled triangles and solid red lines. Galaxies in the field are represented as filled diamonds and solid violet lines. The left panel considers the whole sample, central panel the early-type galaxies, and right panel late types. The binsizes in stellar mass are 0.5 dex for LGs, 0.4 dex for CGs, and 0.3 dex for the field. Abscissas are the medians of the mass within each bin. Bins with fewer than 10 galaxies were excluded. |
| In the text | |
|
Fig. 4 Distributions of the SSFR in our samples. All distributions have been normalised to have the same area. Below each panel we show the residuals between the CGs and the other distributions. KS tests confirm that there is no pair of them drawn from the same underlying distribution. The binsize is 0.37. Colours and line types as in Fig. 1. |
| In the text | |
|
Fig. 5 Distributions of the specific star formation rate (SSFR) for early and late-type galaxies, with panels as in Fig. 2. All distributions have been normalised to have the same area. Below each panel we show the residuals between the CG’s and the other distributions. The binsize is 0.37. KS tests confirm that there is no pair of them drawn from the same underlying distribution. Colours and line types as in Fig. 1. |
| In the text | |
|
Fig. 6 Fraction of star-forming galaxies according to their SSFR (log (SSFR) ≥ − 11) as a function of the stellar mass. Vertical error bars are obtained by using the bootstrap resampling technique. Left panel considers the whole samples of galaxies, central panel the early-type galaxies, and the right panel late types. The bin sizes in stellar mass are 0.5 dex for LGs, 0.4 dex for CGs, and 0.3 dex for the field. Abscissas are the medians of the mass within each bin. Bins with less than 10 galaxies were excluded. Symbols and lines types as in Fig. 3. |
| In the text | |
|
Fig. 7 Distributions of the SSFR of late-type galaxies for log (M∗/M⊙) ≥ 10.5 (left panels) and for log (M∗/M⊙) < 10.5 (right panels). All distributions have been normalised to have the same area. Below each panel, we show the residuals between the CGs and the other distributions. The binsize is 0.37. KS tests confirm that there is no pair of them drawn from the same underlying distribution. However, the distributions between low and high mass LG samples in panels a) and c) are the same above 50%. Colours and line types as in Fig. 1. |
| In the text | |
Current usage metrics show cumulative count of Article Views (full-text article views including HTML views, PDF and ePub downloads, according to the available data) and Abstracts Views on Vision4Press platform.
Data correspond to usage on the plateform after 2015. The current usage metrics is available 48-96 hours after online publication and is updated daily on week days.
Initial download of the metrics may take a while.