Fig. 5
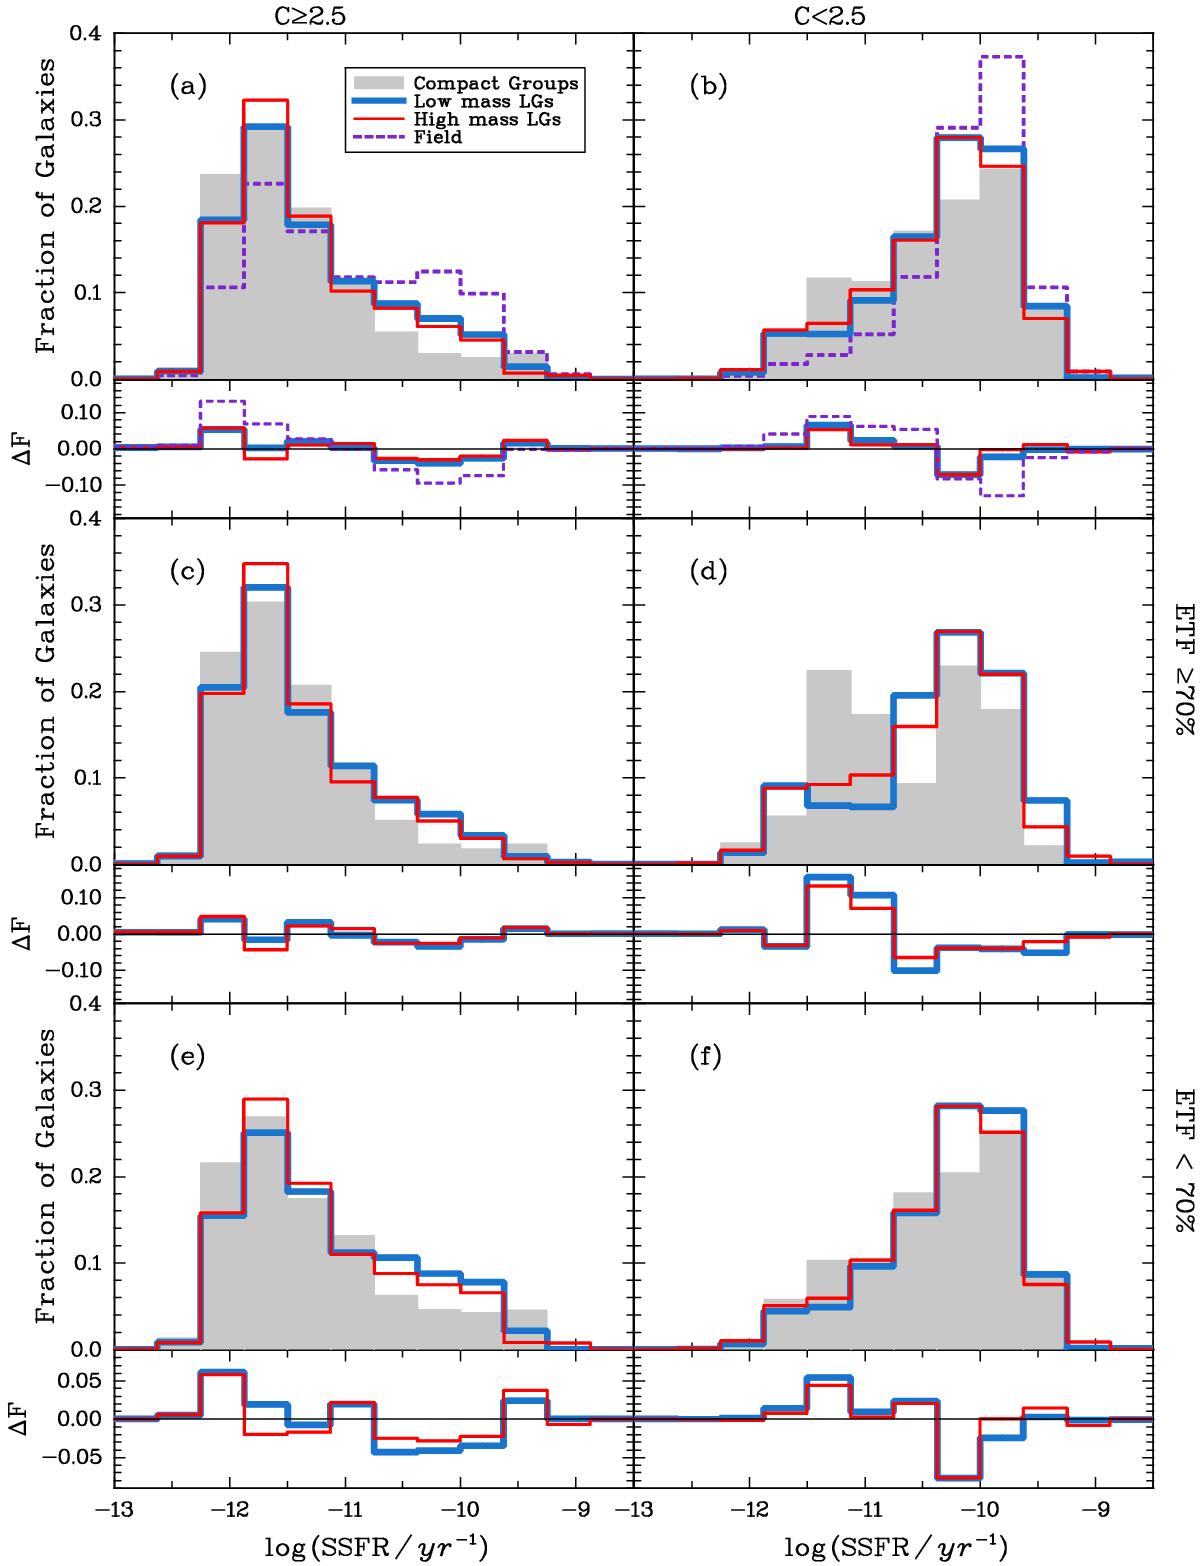
Distributions of the specific star formation rate (SSFR) for early and late-type galaxies, with panels as in Fig. 2. All distributions have been normalised to have the same area. Below each panel we show the residuals between the CG’s and the other distributions. The binsize is 0.37. KS tests confirm that there is no pair of them drawn from the same underlying distribution. Colours and line types as in Fig. 1.
Current usage metrics show cumulative count of Article Views (full-text article views including HTML views, PDF and ePub downloads, according to the available data) and Abstracts Views on Vision4Press platform.
Data correspond to usage on the plateform after 2015. The current usage metrics is available 48-96 hours after online publication and is updated daily on week days.
Initial download of the metrics may take a while.