Fig. 2
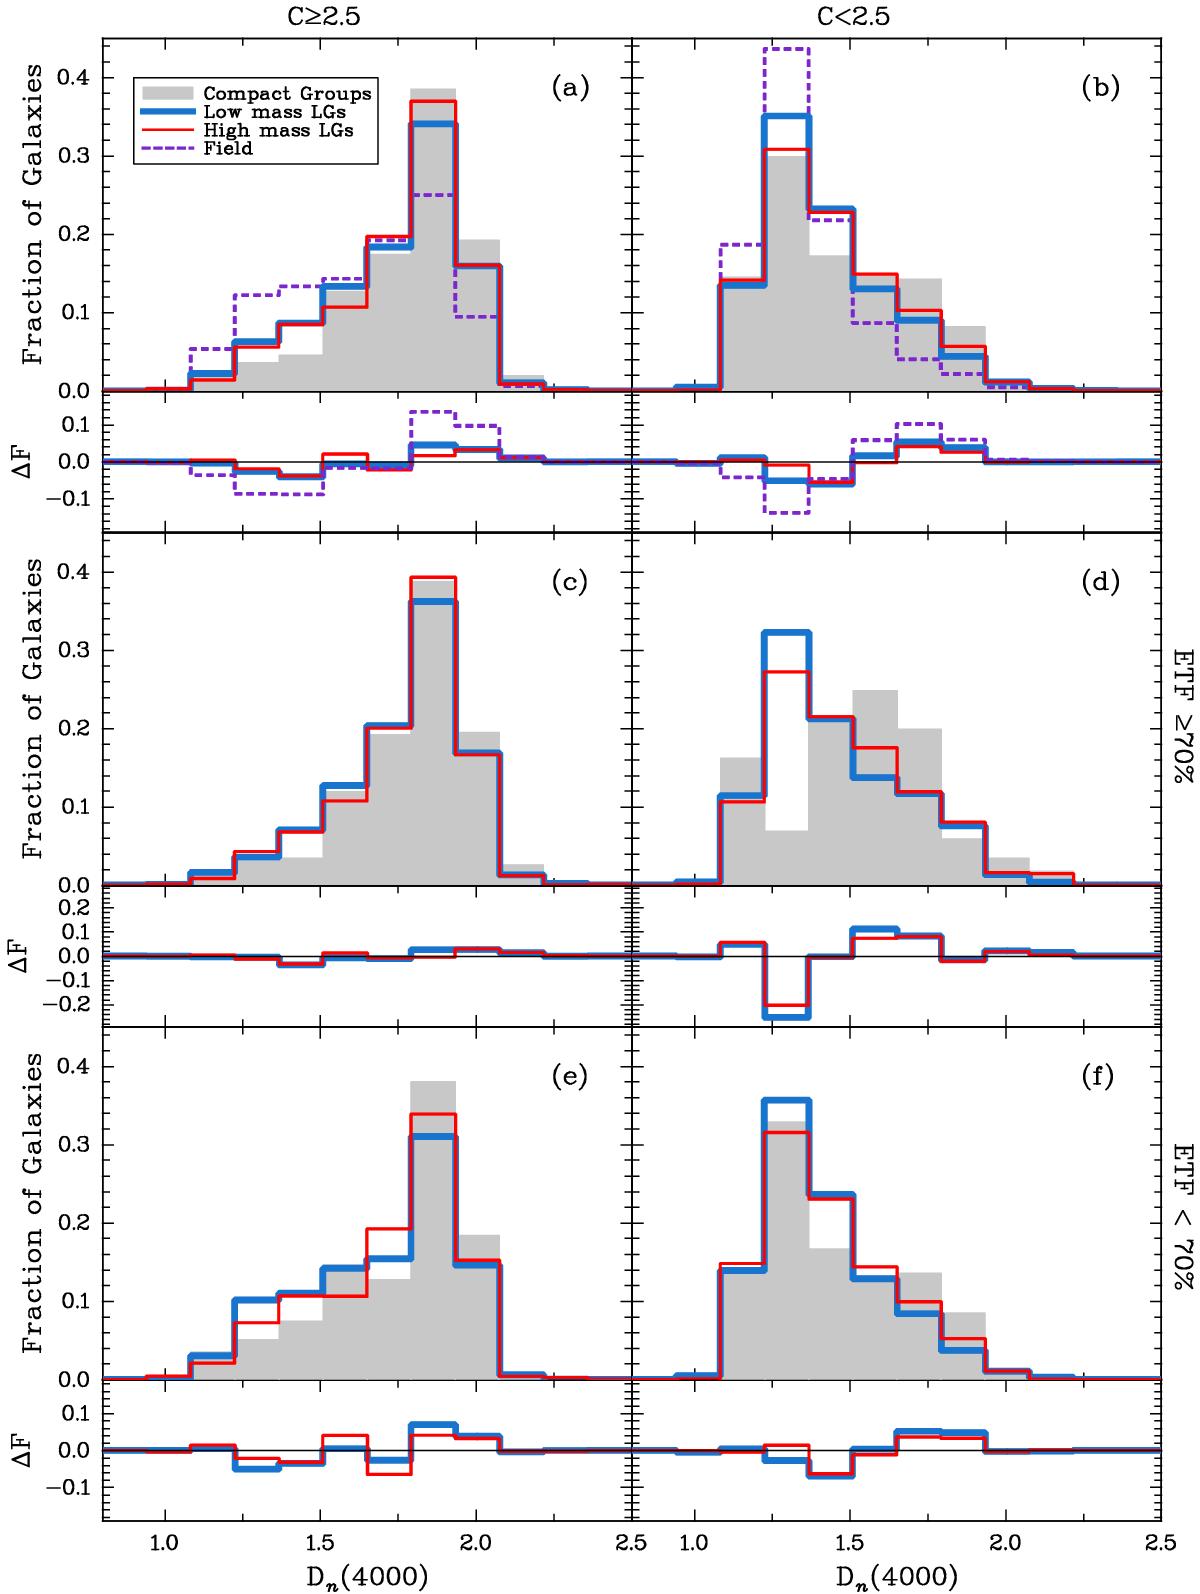
Distributions of Dn(4000) parameter in our samples: left panels include early-type galaxies according to their concentration parameter, while right panels include late-type galaxies in our samples. Panels a) and b) show all galaxies in the samples, panels c) and d) galaxies in groups with ETF ≥ 70%, and panels f) and g) galaxies in groups with ETF < 70%. All distributions have been normalised to have the same area. Below each panel, we show the residuals between the CGs and the other distributions. The binsize is 0.14. Based on KS tests, we find there is no pair of them drawn from the same underlying distribution. Line types are as in Fig. 1.
Current usage metrics show cumulative count of Article Views (full-text article views including HTML views, PDF and ePub downloads, according to the available data) and Abstracts Views on Vision4Press platform.
Data correspond to usage on the plateform after 2015. The current usage metrics is available 48-96 hours after online publication and is updated daily on week days.
Initial download of the metrics may take a while.