Free Access
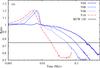
Fig. 9
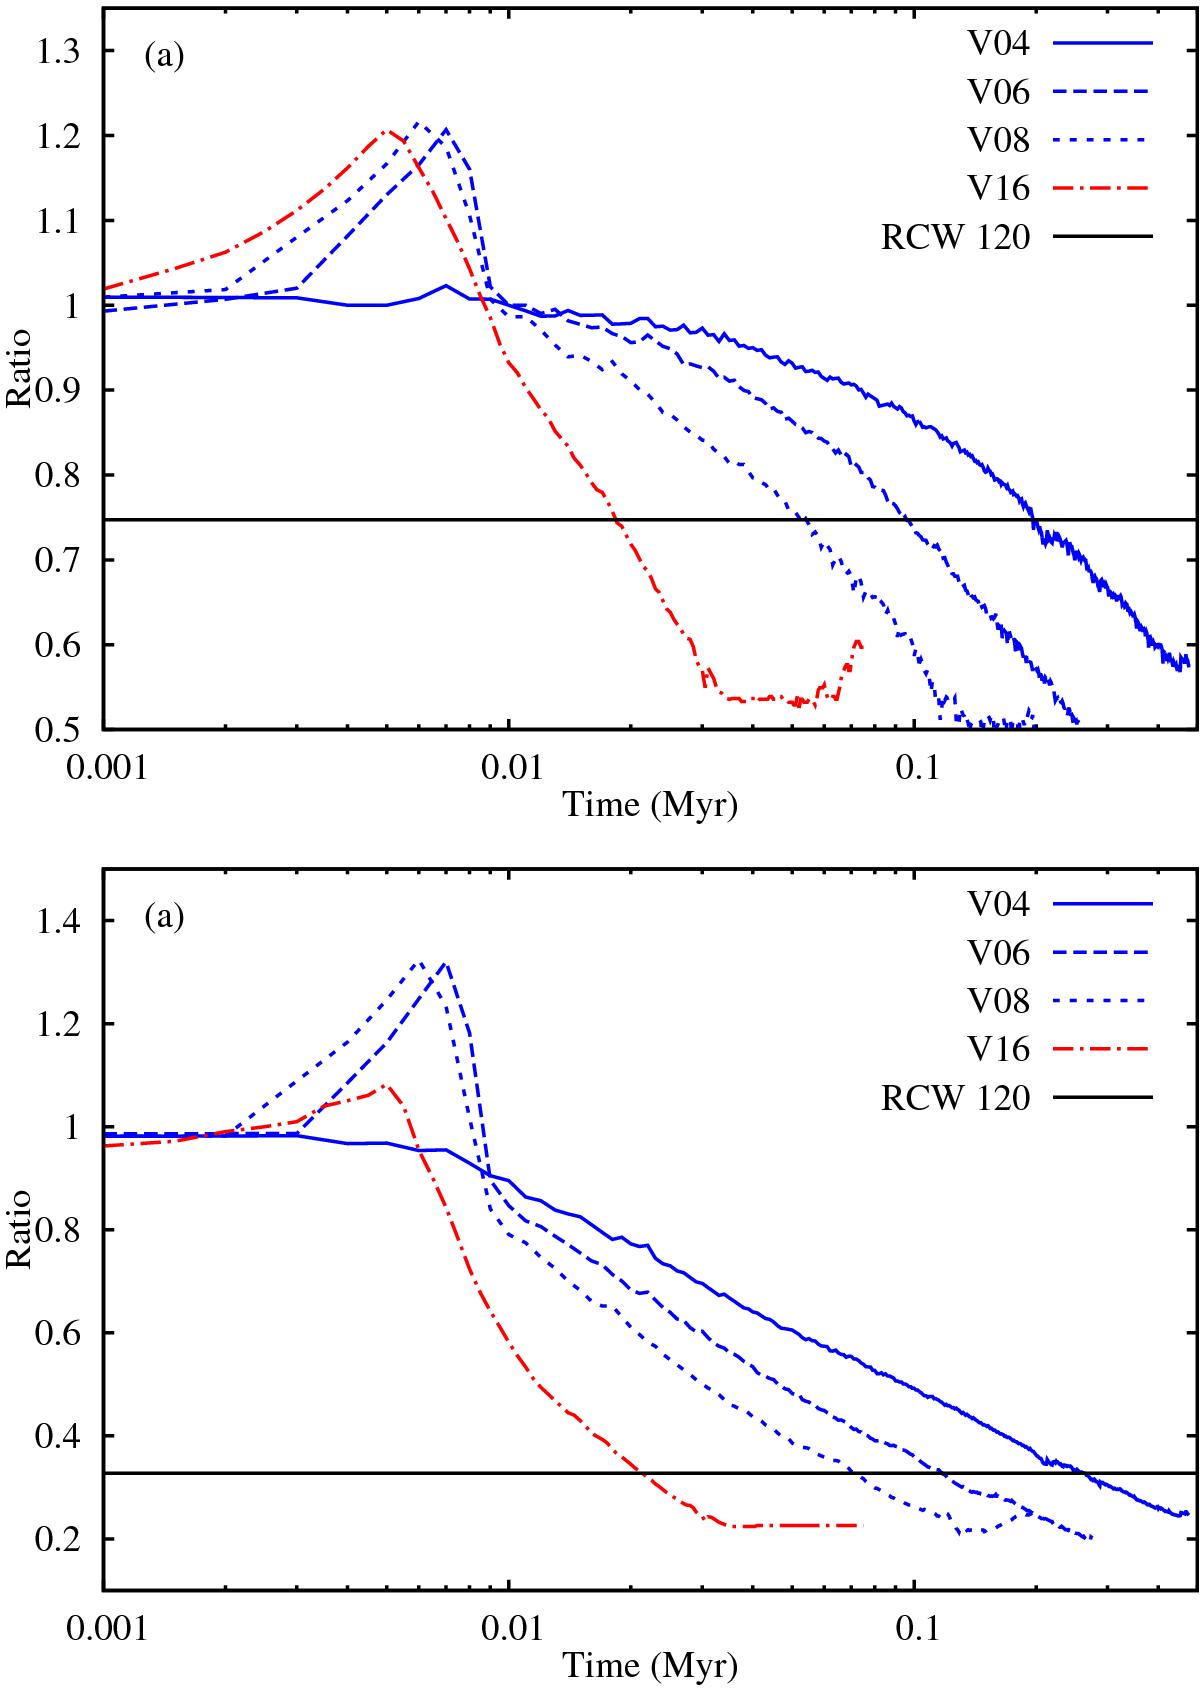
Size ratios of the H ii region shell for the simulations as a function of time. Panel a) shows the breadth-to-length ratio and panel b) shows the upstream-to-downstream ratio, both measured relative to the ionizing star’s position. The horizontal lines show the observed ratios for the H ii region RCW 120.
This figure is made of several images, please see below:
Current usage metrics show cumulative count of Article Views (full-text article views including HTML views, PDF and ePub downloads, according to the available data) and Abstracts Views on Vision4Press platform.
Data correspond to usage on the plateform after 2015. The current usage metrics is available 48-96 hours after online publication and is updated daily on week days.
Initial download of the metrics may take a while.