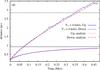
Fig. 8
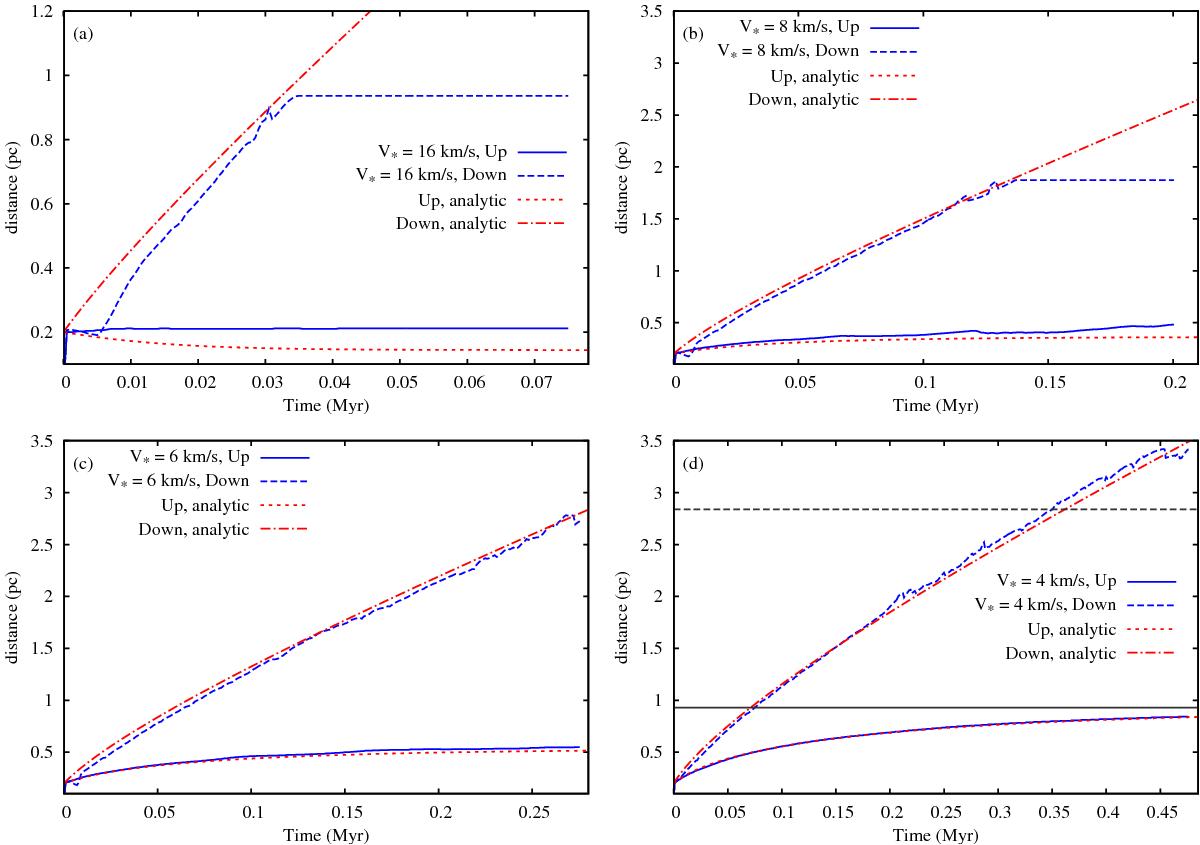
Upstream and downstream H ii region radius as a function of time. Panel a) shows V16, b) shows V08, c) shows V06, and d) shows V04. The blue lines show the numerical results, and the red lines show an analytic approximation obtained by adding an advection term to the usual H ii region expansion equation (see text for details). The horizontal lines at 0.93 pc and 2.84 pc in panel d) show the observed upstream and downstream extent of the H ii region RCW 120.
Current usage metrics show cumulative count of Article Views (full-text article views including HTML views, PDF and ePub downloads, according to the available data) and Abstracts Views on Vision4Press platform.
Data correspond to usage on the plateform after 2015. The current usage metrics is available 48-96 hours after online publication and is updated daily on week days.
Initial download of the metrics may take a while.