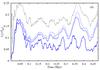
Fig. 6
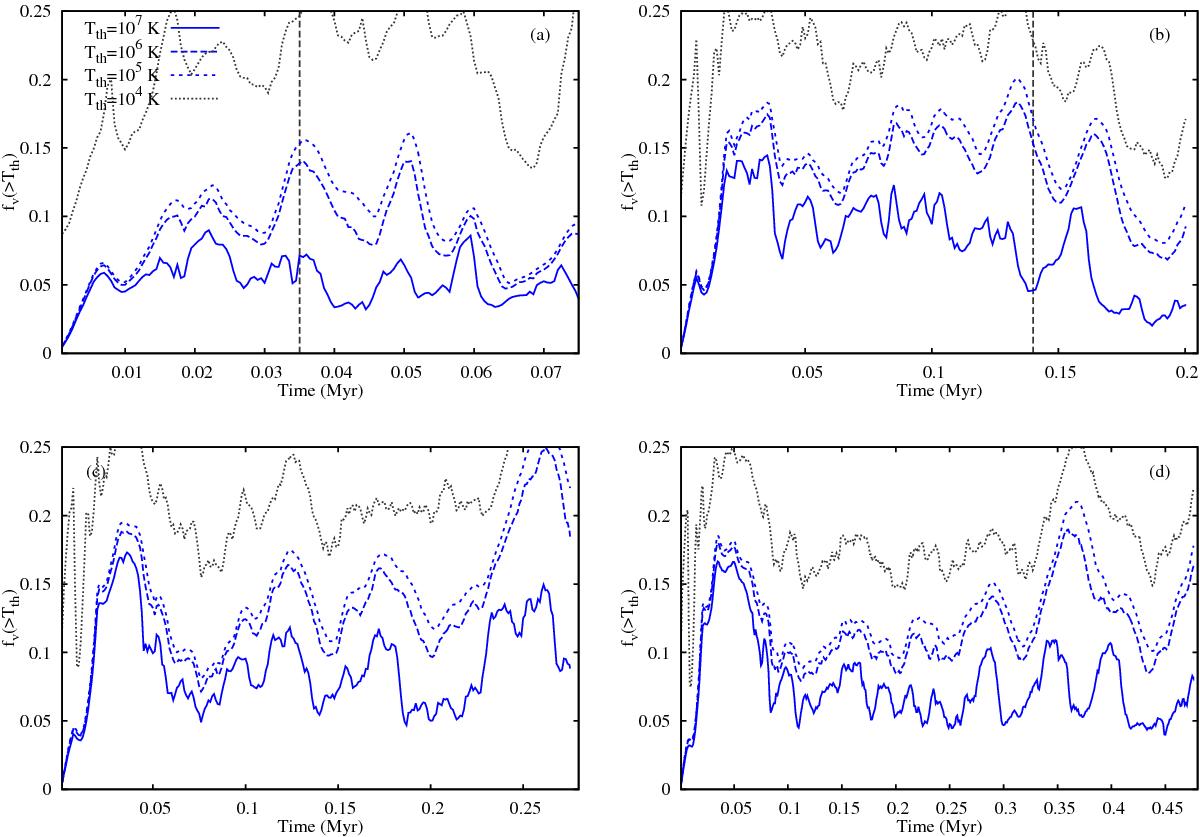
Filling factor in the H ii region of hot gas above the threshold temperatures indicated in the legend, as a function of time. Panel a) is for simulation V16, b) for V08, c) for V06, and d) for V04. The H ii region leaves the simulation domain downstream for simulations V16 and V08 at a time indicated with the vertical lines in panels a) and b). All photoionized gas in the H ii region that has not been shock-heated has 5000 K ≤ T ≤ 10 000 K.
Current usage metrics show cumulative count of Article Views (full-text article views including HTML views, PDF and ePub downloads, according to the available data) and Abstracts Views on Vision4Press platform.
Data correspond to usage on the plateform after 2015. The current usage metrics is available 48-96 hours after online publication and is updated daily on week days.
Initial download of the metrics may take a while.