Fig. 11
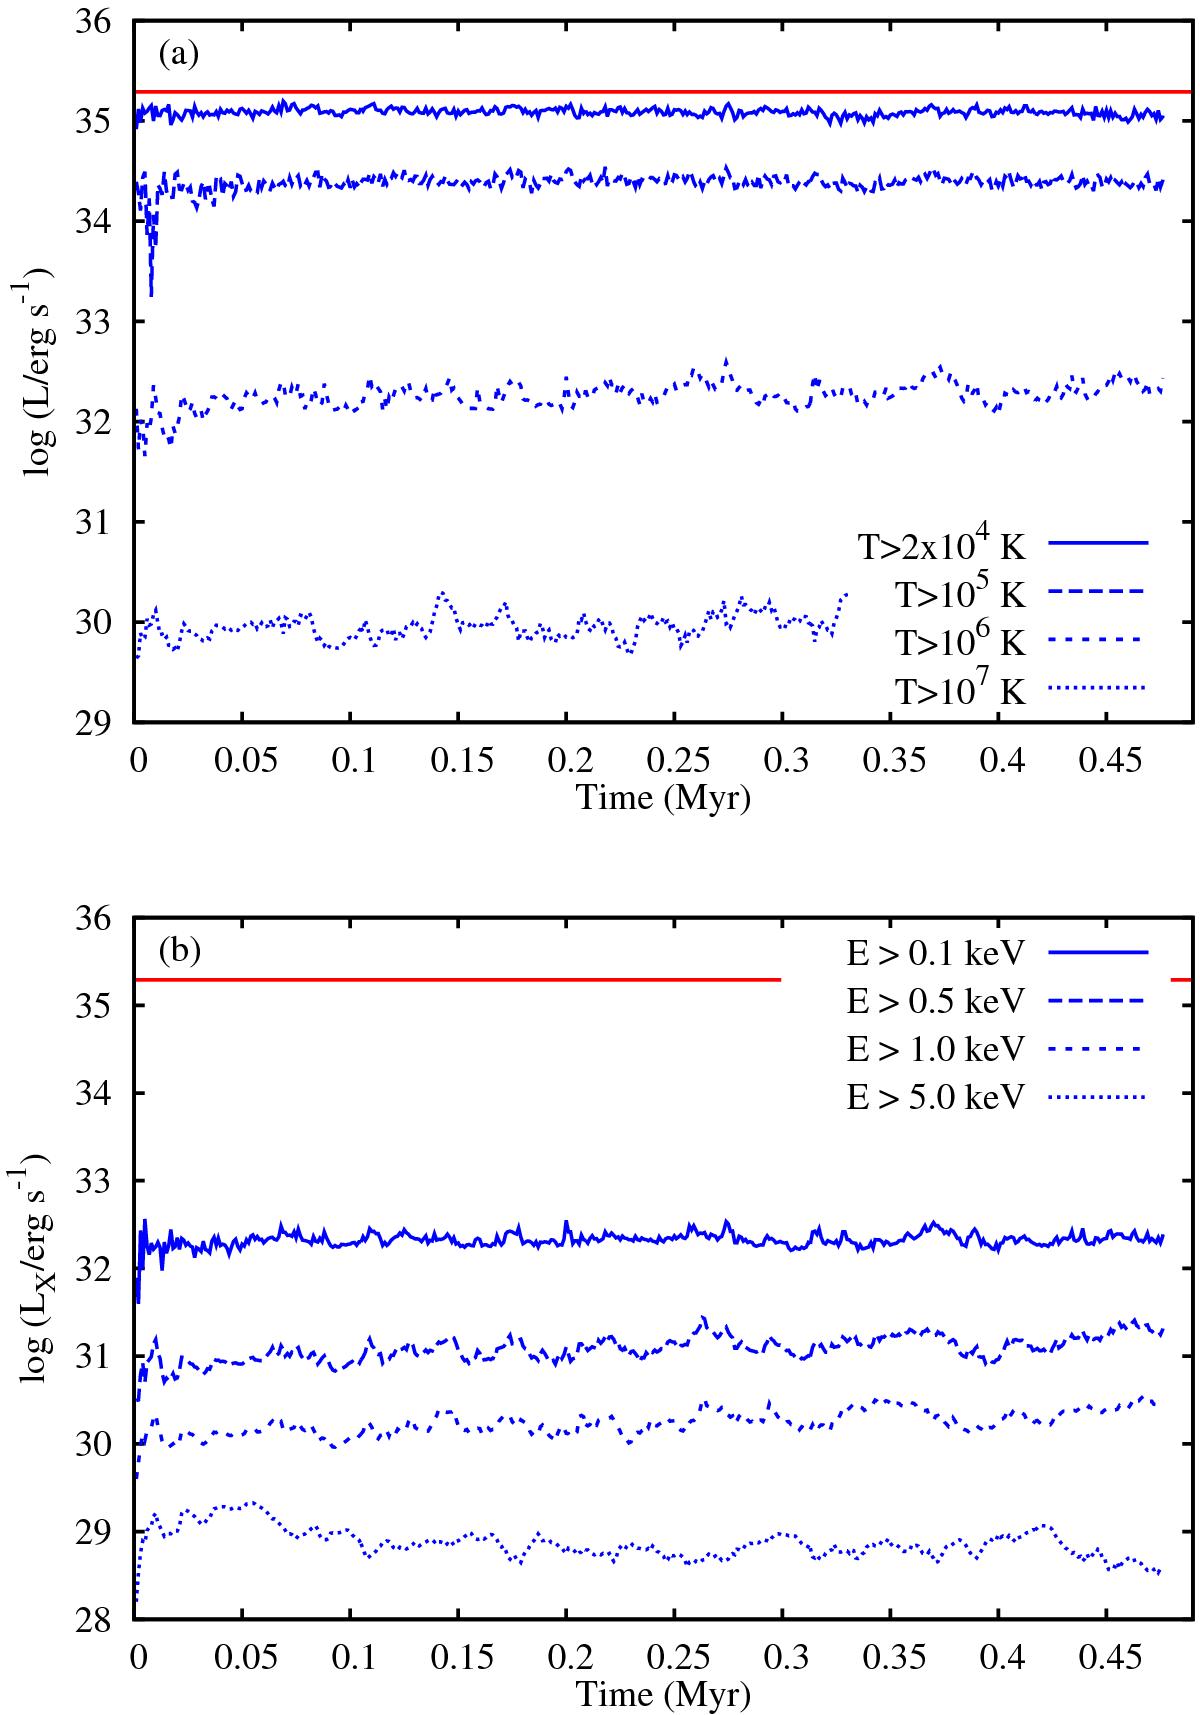
Total and X-ray cooling from the stellar wind bubble of simulation V04 as a function of time. Panel a) shows the total cooling luminosity of all gas with T> 2×10⁴, 105, 106, and 107 K (for the lower temperatures most of this is not in at X-ray wavelengths). Panel b) shows the total (unattenuated) X-ray luminosity above energies E> 0.1, 0.5, 1.0, and 5.0 keV, calculated assuming collisional ionization equilbrium and solar abundances (see text for details). In both panels the red horizontal line shows the mechanical luminosity of the stellar wind, ![]() .
.
Current usage metrics show cumulative count of Article Views (full-text article views including HTML views, PDF and ePub downloads, according to the available data) and Abstracts Views on Vision4Press platform.
Data correspond to usage on the plateform after 2015. The current usage metrics is available 48-96 hours after online publication and is updated daily on week days.
Initial download of the metrics may take a while.