Fig. 10
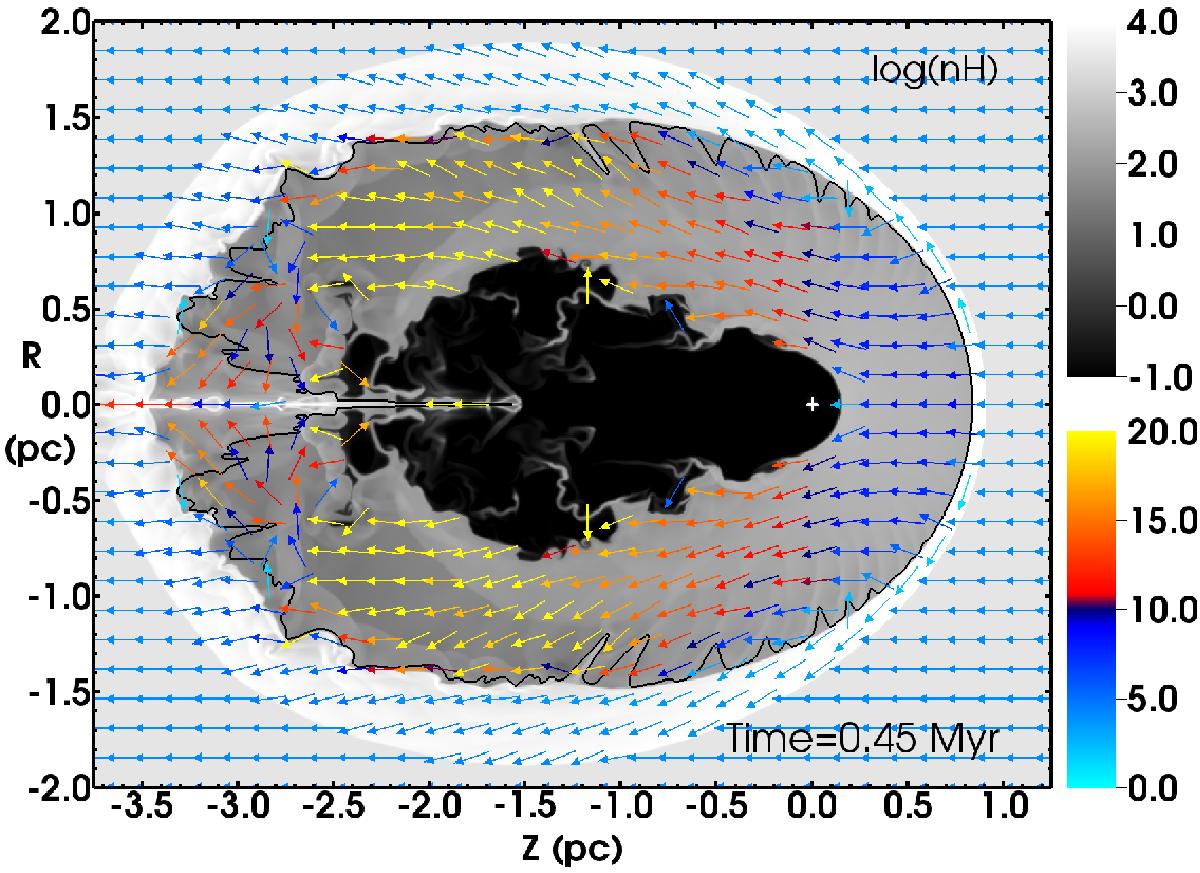
Log of nH (greyscale) and gas velocity relative to the star (coloured arrows) for simulation V04, with units log (nH/ cm-3) and km s-1, respectively. The radial direction is vertical, and the axis of symmetry is R = 0, the z-axis. The solid black contour shows x = 0.5. The star is at the origin, denoted by a white cross. Regions with gas velocity >30 km s-1 are excluded from the velocity plot for clarity, and velocities from 20 to 30 km s-1 all have the same colour arrows (yellow). An animation of the simulation’s evolution is available online.
Current usage metrics show cumulative count of Article Views (full-text article views including HTML views, PDF and ePub downloads, according to the available data) and Abstracts Views on Vision4Press platform.
Data correspond to usage on the plateform after 2015. The current usage metrics is available 48-96 hours after online publication and is updated daily on week days.
Initial download of the metrics may take a while.