Free Access
Fig. 4
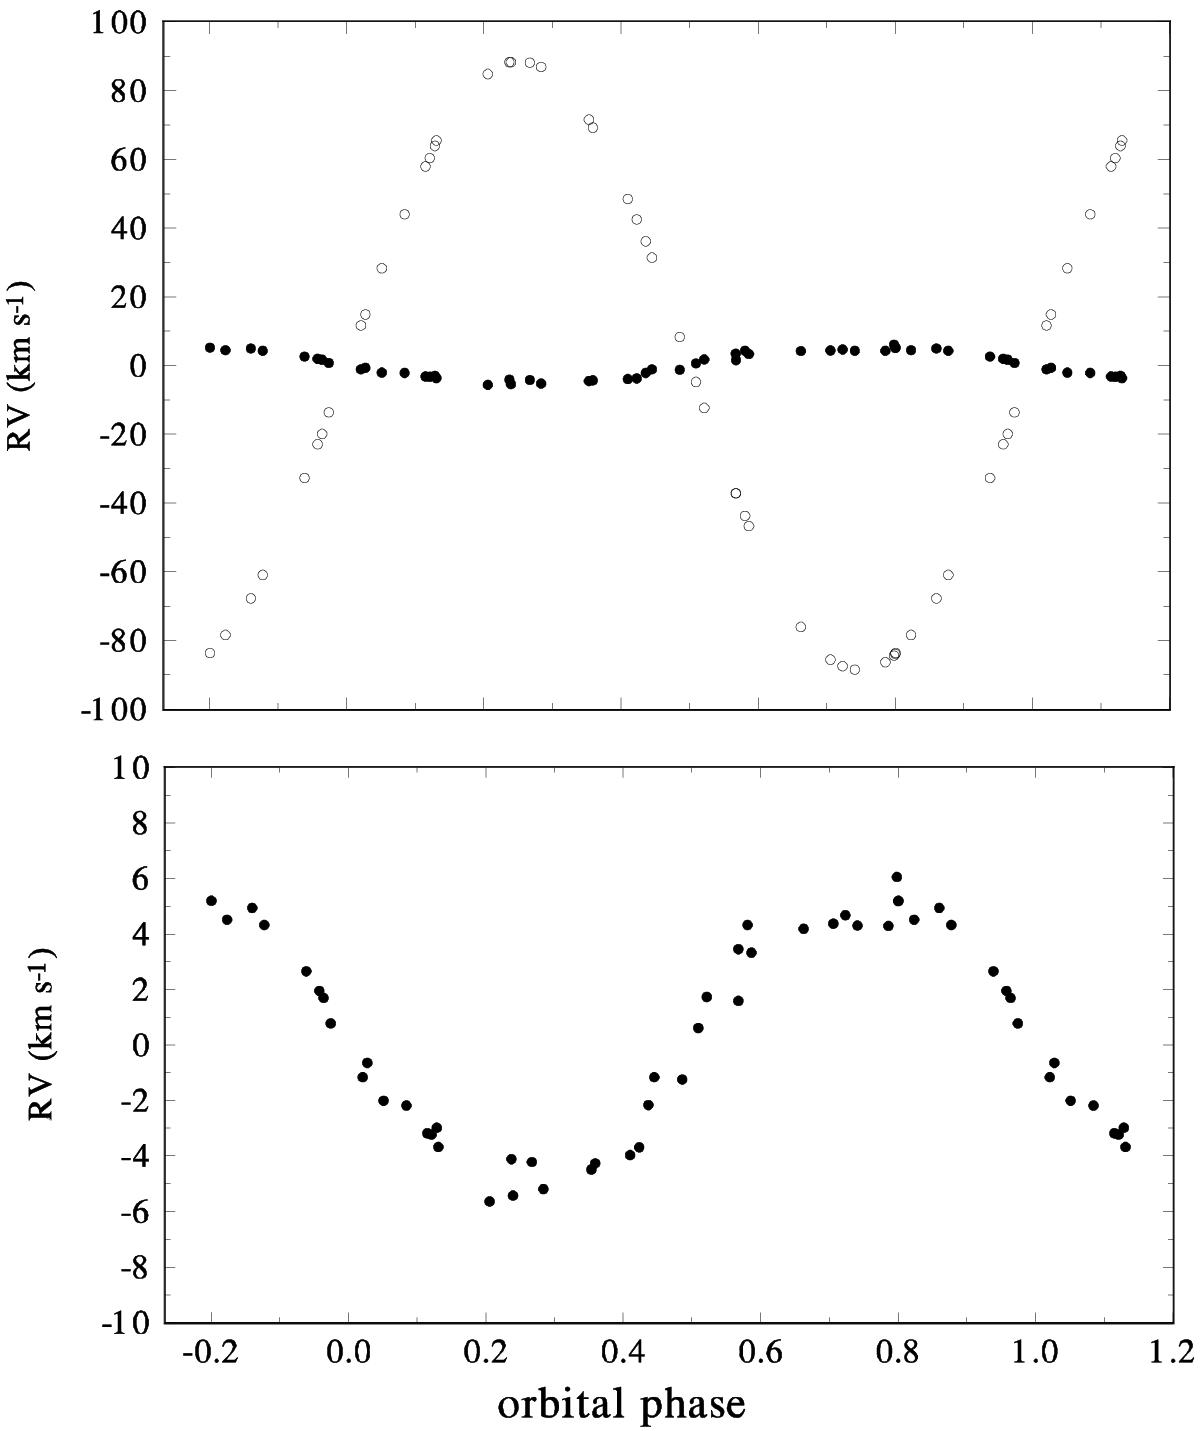
Top: orbital RV curve of both components of BR CMi based on RVs derived via 2D cross-correlation. Bottom: zoomed RV curve of component 1 from the upper panel showing how accurately the RVs were derived via the 2D cross-correlation.
Current usage metrics show cumulative count of Article Views (full-text article views including HTML views, PDF and ePub downloads, according to the available data) and Abstracts Views on Vision4Press platform.
Data correspond to usage on the plateform after 2015. The current usage metrics is available 48-96 hours after online publication and is updated daily on week days.
Initial download of the metrics may take a while.