| Issue |
A&A
Volume 573, January 2015
|
|
|---|---|---|
| Article Number | A58 | |
| Number of page(s) | 7 | |
| Section | Astrophysical processes | |
| DOI | https://doi.org/10.1051/0004-6361/201424604 | |
| Published online | 16 December 2014 | |
Displacement of X-ray binaries: constraints on the natal kicks
1
School of Science, Xi’an Jiaotong University,
710049 Xi’an, PR
China
2
Key laboratory of Modern Astronomy and Astrophysics (Nanjing
University), Ministry of Education,
210093
Nanjing, PR
China
e-mail:
This email address is being protected from spambots. You need JavaScript enabled to view it.
Received: 15 July 2014
Accepted: 22 October 2014
Abstract
Context. This work uses the measured luminosity vs. displacement (LX vs. R) distribution of high-mass X-ray binaries (HMXBs) to constrain the dispersion of kick velocity σkick, which is an important parameter affecting the system velocity of a binary, and hence its spatial offset from the point of origin.
Aims. The aim is to constrain the natal kicks and discriminate between models by comparing the observed LX vs. R distributions with the theoretical simulations.
Methods. Using an up-to-date evolutionary population synthesis technique, the spatial offsets of HMXBs are modeled for a range of theoretical models describing the natal kicks, including different choices of the dispersion of kick velocity σkick, as well as different theoretical treatments for black hole (BH) natal kicks.
Results. The study shows that the value of σkick for neutron stars (NSs) is constrained to be greater than ~100 km s-1, while σkick on the order of several tens of km s-1 may be excluded, though a low or absent natal kick for electron capture supernovae NSs is permitted. In particular, BH natal kicks are found not indispensable to account for the LX vs. R distributions. It is more interesting that full BH natal kicks (i.e., similar to those that NSs may receive) are likely to be ruled out in this study, which is in contrast with the recent finding to explain the observed distribution of low-mass X-ray binaries hosting BHs.
Key words: stars: evolution / X-rays: binaries / X-rays: galaxies: clusters / X-rays: general / galaxies: starburst / binaries: general
© ESO, 2014
1. Introduction
Over the past few decades, it has left little doubt that neutron stars (NSs) receive recoil kicks (also called natal kicks) at birth. This concept is based on studies on the proper motion of pulsars (Cordes et al. 1993; Lyne & Lorimer 1994; Hobbs et al. 2005), supernova (SN) remnant associations, and characteristics of NS binaries (e.g., Lai et al. 2001; for reviews, see Lai 2001). Their speeds are observed in the range of ~200−500 km s-1 on average, and may be in excess of 1000 km s-1 for the fastest, but its functional form of the underlying speed is still not clearly understood yet.
Whether stellar mass black holes (BHs) receive similar natal kicks or not is still a matter of debate. Some systems seem to require no or at most a small natal BH kick (e.g., Cygnus X-1; Nelemans et al. 1999; GRS 1915+105; Dhawan et al. 2007; and Cygnus X-1; Wong et al. 2010); while others prefer a more appreciable one (e.g., GRO J1655-40; Willems et al. 2005; and XTE J1118+480; Remillard et al. 2000; Mirabel et al. 2001; Gualandris et al. 2005; Fragos et al. 2009). These conclusions are mainly based on detailed evolutionary modeling for the observed individuals. By using current available informations such as the space velocity, orbital parameter, and its location, one can trace back the evolutionary history of known BH X-ray binaries (XRBs), and derive constraints on the range of allowed natal kick imparted to the newborn BH, though the conclusion sometimes contains some ambiguity.
Another way to constrain natal kicks is to perform binary population synthesis (BPS) simulations. By comparing the predictions with the observed properties of sources interested, the natal kick can be properly constrained. Such works have been carried out extensively by several authors, such as Deway & Cordes (1987), Fryer & Kalogera (1997a,b), Fryer et al. (1998), Belczynski et al. (2010b) on single pulsars and/or double NS binaries, and Repetto et al. (2012) on BH XRBs. For example, recently, Repetto et al. (2012), by comparing the synthesized BH low-mass X-ray binary (LMXB) population with the Galactic distribution, concluded that BHs are most likely to have the same/similar distribution of kick velocities as NSs. Their method is to integrate the trajectories of the binary systems within the Galactic potential. They found that different theoretical kick distributions give distinct spatial distributions of BH LMXBs, which serves as a useful way to discriminate between models. We note that this method is very sophisticated and has been widely explored for other purposes (Zuo et al. 2008; Zuo & Li 2010, 2014a).
Summary of models.
High-mass X-ray binaries (HMXBs) also have their unique spatial distributions. They are observed to trace the spiral arms and star formation regions across the galaxy owing to their short lifetimes. Specifically, Kaaret et al. (2004), using data from Chandra and NICMOS on board Hubble Space Telescope (HST) of X-ray sources and star clusters, respectively, studied their spatial offsets from the closest star clusters from a statistical point of view. They found that the X-ray sources are in general located near the star clusters, and brighter sources are most likely closer to the clusters. Moreover, there is an absence of luminous sources (LX> 1038 erg s-1) at relatively large displacements (> 200 pc) from the clusters.
In this work, I applied an up-to-date BPS technique to model the spatial offsets of sources in Kaaret et al. (2004) samples. I integrate the trajectories of the binary systems within the cluster potential for a range of theoretical models describing the natal kicks. I consider different choices of the dispersion of kick velocity σkick, as well as different theoretical treatments for BH natal kicks (see Sect. 2.1). I compare the observed LX vs. R distributions with the theoretical simulations, which may help understand the natal kicks and discriminate between models.
This paper is organized as follows. In Sect. 2 I describe the population synthesis method and the input physics for XRBs in the model. The calculated results are presented in Sect. 3. The conclusions and discussions are in Sect. 4.
2. Model description
2.1. Assumptions and input parameters
I have used the BPS code initially developed by Hurley et al. (2000, 2002) and recently updated by Zuo et al. (2014) to calculate the expected numbers for various types of XRB population. This code incorporates recent progress concerning the evolution of single and binary stars, such as the mass loss prescription for winds in massive stars (Vink et al. 2001; also see Belczynski et al. 2010a,b), compact object mass prescription (Fryer et al. 2012, i.e., the rapid supernova mechanism), and common envelope (CE) evolution, etc. For CE evolution, there are two updates, a variable λ (Zuo et al. 2014; also see Xu & Li 2010 and Loveridge et al. 2011) and a new CE criterion for Hertzsprung gap donors (Shao & Li, priv. comm.; see also Appendix A in Zuo et al. 2014). Recent simulations on HMXBs and their kinematics (Zuo et al. 2014; Zuo & Li 2014b,a) show that the common envelope efficiency αCE may be within 0.8−1. So I adopt αCE = 0.9 and keep this assumption throughout.
The galaxies (M 82, NGC 1569, and NGC 5253) studied by Kaaret et al. (2004) all undergo a starburst for no more than 20 Myr, so I adopt a constant star formation rate for 20 Myr to model the HMXB populations. In each model, I evolve 8×10⁶ primordial binaries. The grids of initial parameters (i.e., primary mass, secondary mass, and orbital separation) are set up in the same way as in Hurley et al. (2002). The values of other adopted parameters are the same as the default ones in Hurley et al. (2002) if not mentioned otherwise. The initial mass function of Salpeter is taken for the mass of the primary (M1) distribution. For the secondary’s mass (M2), I assume a uniform distribution of the mass ratio q ≡ M2/M1 between 0 and 1 and of the logarithm of the orbital separation lna. Tidal effect is also taken into account to remove any eccentricity induced in a post-SN binary prior to the onset of mass transfer.
When a binary survives a SN explosion, it receives a velocity kick as a result of any asymmetry in the explosion (Lyne & Lorimer 1994). Though the natal SN kick has long been studied (Bailes 1989), its functional form, including the amount or the distribution of the underlying speed, is still not clearly understood. Usually the kick velocity vk,NS is assumed to be imparted on the new-born NS with a Maxwellian distribution, 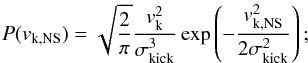 (1)however the amount of σkick, velocity dispersion, has diverse values in the literature. For example, the value of σkick is expected to be in excess of ~100−200 km s-1 based on measurements of proper motions for isolated radio pulsars (Lyne & Lorimer 1994; Hansen & Phinney 1997; Cordes & Chernoff 1998; Arzoumanian et al. 2002; Hobbs et al. 2005), but is expected to be smaller based on recent observation of NSs found in binaries (on the order of 100 km s-1, Pfahl et al. 2002; Belczynski et al. 2010b; Wong et al. 2010; Bodaghee et al. 2012) and BPS simulations (on the order of ~150 km s-1, Zuo et al. 2014; Belczynski et al. 2010b). I adopt σkick = 150 km s-1 in the basic model (model BAC, see Table 1). In order to make a constraint on the value of σkick, I also adopt σkick = 50 (model M1), 100 (i.e., model M2, Bodaghee et al. 2012), and 265 km s-1 (i.e., model M3, Hobbs et al. 2005) to test its effect.
For BH natal kicks, determining the value is more controversial. Whether stellar mass BHs receive natal kicks or not is still a matter of debate. For simplicity, I assume that the natal kick velocity for BHs (vk,BH) can be described as 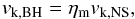 (2)where ηm is the modified factor, and vk,NS is the velocity drawn from the same Maxwellian kick distribution as for NSs. In the basic model, the fallback prescription (Fryer et al. 2012; see also Dominik et al. 2012) is adopted, with ηm = 1 − fb, where fb, ranging between 0 and 1, is the fraction of the stellar envelope that falls back. Here fb = 0 represents no fallback (i.e., full kicks) and 1 indicates total fallback (no kick, or without a SN explosion). Specifically BHs formed with small amounts of fallback (Mfb< 0.2 M⊙) are assumed to receive full kicks. I assume no natal kick for electron capture supernovae (ECS, Podsiadlowski et al. 2004) NSs1.
I also adopt the conventional momentum-conserving prescription for comparison. In this case, ηm = MNS/MBH (model M6), where MNS, MBH denote the mass of NS and BH. In addition, recent work by Repetto et al. (2012) indicates that the natal kick of BHs seem to be similar to that of NSs, in order to explain the observed distribution of LMXBs with BHs. So I also set ηm = 1 (model M5), i.e., full natal kicks for BHs as observed for NSs, independent of the amount of fallback. For another extreme case, BHs may not receive natal kicks at all, so I adopt ηm = 0 (model M4) in this case, and natal kicks are assumed to be independent of their mass or the amount of fallback.
The system velocity (vsys) of the binary can be calculated as follows (Blaauw 1961; also see Hurley et al. 2002, for details), 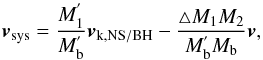 (3)where
  is the current mass of the primary after losing mass ΔM1 during the SN explosion, Mb = M1 + M2 and
  are the total masses of the system before and after the SN, respectively, and v is the relative orbital velocity of the stars (see Eq. (A1) in Hurley et al. 2002). One can see that the system velocity vsys is closely related to the natal kicks.
2.2. Binary motion in the cluster potential
To model the centrally concentrated star cluster in star-burst regions, I adopt a spherical potential in the form of the cylindrical coordinate system (r, φ, z), 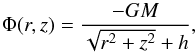 (4)where h is the half light radius, M is the total mass of stars within h, and the origin of the coordinate is set at the cluster’s center. For typical star clusters, M = 1.0×10⁶M⊙, and h = 3 pc (Ho & Filippenko 1996a,b) are adopted2. All stars are then assumed to be born uniformly in the star cluster (i.e., within a radius of 3 pc), with randomly designated direction of initial velocities, expressed as initial velocity vectors vr, vφ, vz. Because of symmetries, two space coordinates r and z are sufficient to describe the HMXB distributions. Through integrating the motion equations (see Eqs. (19a) and (19b) in Paczyński 1990) with a fourth-order Runge-Kutta method, I can calculate the trajectories of the binaries and collect the parameters of current binaries if turning on X-rays. Finally, I project the binary positions on the φ = 0 plane to get the projected distances of HMXBs from star clusters, i.e., R = ((rcosϕ)2 + z2)1 / 2 with ϕ uniformly distributed between 0 and 2π. In my calculations, the accuracy of integrations is controlled by the energy integral and kept better than 1 part in 106.
2.3. X-ray luminosity and source type
I adopt the same procedure to compute the 0.5−8 keV X-ray luminosity for different kinds of HMXBs as in Zuo et al. (2014). In this study, I do not consider Be-XRBs and LMXBs (donor mass < 2 M⊙) since they are unlikely to dominate in the Kaaret et al. (2004) sample. Usually, HMXBs are powered by either stellar winds or Roche-lobe overflow (RLOF). I adopt the classical Bondi & Hoyle (1944) formula for wind-fed cases. For RLOF systems, persistent and transient sources are identified using the criteria of Lasota (2001, see Eq. (36) therein) for MS and red giant stars. The simulated X-ray luminosity is then described as 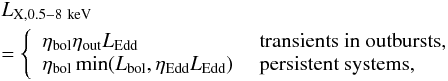 (5)where ηbol is the bolometric correction factor, adopted as 0.2 for NS-XRBs and 0.4 for BH-XRBs, respectively, though its range is ~0.1−0.8 for different types of XRBs (Belczynski et al. 2008); the bolometric luminosity
  where Ṁacc is the average mass accretion rate and c is the speed of light; and the critical Eddington luminosity LEdd ≃ 4πGM1mpc/σT = 1.3×1038m1 erg s-1 (where σT is the Thomson cross section, mp is the proton mass, and m1 is the accretor mass in solar units). The Begelman factor ηEdd examines the allowed maximum super-Eddington accretion rate. Here I adopt ηEdd,NS = 5 for NS XRBs and ηEdd,BH = 100 for BH XRBs (Zuo et al. 2014), respectively; ηout is the fraction factor of the critical Eddington luminosity for the outburst luminosity of transient sources. I take the values of ηout 0.1 and 1 for NS(BH) transients with orbital period Porb less and longer than 24 h(10 h), respectively (Chen et al. 1997; Garcia et al. 2003; Belczynski et al. 2008).
3. Results
Based on a population of 66 X-ray point sources, Kaaret et al. (2004) found that bright X-ray sources in three starburst galaxies (M 82, NGC 1569, and NGC 5253) are preferentially located near the star clusters, with the brighter sources located closer to the clusters. Moreover, there is no luminous source (LX> 1038 erg s-1) at relatively large displacements (> 200 pc) from the clusters. Here I modeled the kinematic evolution of XRBs in clusters under different treatments of natal kicks and present the results below.
As stated before, I constructed seven models to investigate how the final results are influenced by the adopted parameters. Specifically, the input parameters in the basic model (i.e., model BAC) are σkick = 150 km s-1, and a fallback prescription (ηm = 1−fb) for BH kicks. In other models I changed only one parameter each time, and the model parameters are listed in Table 1. In order to compare with Kaaret et al. (2004), a two-dimensional Kolmogorov-Smirnov (2D K-S) test (Fasano & Franceschini 1987) was performed. It was done between the simulated displacement distributions and the average ones. We calculated the average distributions using the observed data (combining the data of the three galaxies). For the simulated distributions, only sources in the luminosity range 1036−1038 erg s-1 were selected in order to be in line with Kaaret et al. (2004). Then we were able to get a preliminary decision for the parameter σkick by seeing the derived possibility (i.e., p-value, less than ~0.01 suggests a significant different distribution, see Table 2). Finally, the LX vs. R distributions were used in a phenomenological way to further discriminate between models (i.e., the secondary check for the models, see also Zuo & Li 2014a).
Two-dimensional K-S test for models M1−M6 and BAC.
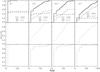 |
Fig. 1 Normalized cumulative distribution for the numbers of ALL-XRBs (top), NS-XRBs (middle), and BH-XRBs (bottom), respectively. The thick-dotted and dashed lines represent the relative numbers of NS- and BH-XRBs contributing to ALL-XRBs, respectively. The thin-solid, dotted, and dashed lines represent the observed cumulative distributions of source displacements in galaxies M 82, NGC 1569, and NGC 5253 (see Fig. 2 in Kaaret et al. 2004), respectively. From left to right are models M1, M2, BAC, and M3. |
Figure 1 shows the simulated cumulative distribution of X-ray source displacements (top: Total, along with the relative contributions of NS- and BH-XRBs; middle: NS-XRBs; bottom: BH-XRBs) in the luminosity range 1036<LX< 1038 erg s-1 under different choices of σkick. Each histogram is normalized by the total number of HMXBs within 1 kpc of a star cluster, but the innermost 10 pc region is excluded because of the selection effect of the detection (resolution scale: ~10 pc). Sources within 10 pc are still extremely difficult to resolve as in the Kaaret et al. (2004) sample. The differences are significant. Too weak natal kicks (i.e., models M1, possibility ~10-9) are not sufficient to kick enough sources to large displacements from star clusters. In order to be compatible with the observations, the value of σkick should be greater than ~100 km s-1 (see models BAC, M2, and M3, and Table 2), while σkick on the order of several tens of km s-1 (see model M1) can be excluded. It can be seen more clearly in Fig. 2 for normalized distributions of X-ray luminosities (LX) at different displacements (R) for the same four models. The color bar represents the normalized number ratio (or occurrence possibility) of XRBs in the LX − R plane. When the occurrence possibility is higher, more sources are expected to be observed there. The conclusion remains unchanged. The predicted LX vs. R correlations in models BAC, M2, and M3 are generally compatible with the observations, while it cannot be reconstructed for lower σkick. In addition, the observed sources in the low luminosities around ~10 pc region (i.e., BH XRBs) are lower than theoretical expectations (Mineo et al. 2012; Zuo et al. 2014). It is most likely due to the selection effect of the detection. They are more likely crowding within the small offset regions, which has not been resolved yet. Future high-resolution optical and X-ray observations in this region may further testify the results obtained here. We note that the results are also consistent with the one obtained through HMXB XLF simulations recently presented by Zuo et al. (2014).
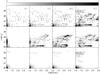 |
Fig. 2 LX − R distribution for ALL-XRBs (top), NS-XRBs (middle), and BH-XRBs (bottom). Sources from M 82, NGC 1569, and NGC 5253 in Kaaret et al. (2004, see their Fig. 3 samples are also shown as diamonds, triangles and squares, respectively for comparison. From left to right are models M1, M2, BAC, and M3. |
 |
Fig. 5 Normalized system velocity distributions for BH (solid line) and NS (dotted line) XRBs in models M1−M6, and BAC, respectively. |
Figures 3 and 4 are the same as in Figs. 1 and 2 but for different treatments of the BH natal kicks (models M4−M6 vs. model BAC). I fixed the value of σkick at 150 km s-1 and applied three more forms of natal kicks that BHs may receive. The results show that in order to be compatible with the observations, BH natal kicks are not indispensable at all. It can be seen clearly from model M4 (i.e., no BH kicks) in Figs. 3 and 4 that both the cumulative distribution and LX vs. R correlations of XRBs can be reconstructed quite closely. This can be easily understood when referring to Eq. (3), that even in the absence of natal kicks from SNe, the binary system can still get velocities because the ejected mass lost during the SNe will give the binary a runaway velocity in the opposite direction to conserve momentum (Nelemans et al. 1999; van den Heuvel et al. 2000). The magnitude of the speed can be as large as several tens of km s-1, which ensures that the BH XRB would move, even as far as several tens of pc away from the point of origin. The models with reduced BH natal kicks (models BAC and M6) can also match the observations quite closely. I also set ηm = 0.1 tentatively, and find no significant difference from models M4, M6, and BAC. However, when full natal kicks are applied to BHs (model M5, possibility ~10-4), the differences are remarkable. BH XRBs dominate the whole population in the interested offset region, significantly different from other models. BH XRBs in model M5 can move to much farther places away from clusters, especially for low luminosity sources (1036<LX< 1037 erg s-1), too many of which are predicted to appear in large displacements, which is in marked contrast with observations. These sources are predicted to be mainly long-period BH systems powered by stellar winds from high mass (~30−75 M⊙) MS companions (Zuo et al. 2014, also see Fig. 4 therein for a typical evolutionary sequence). I suggest that the discovery of such sources by additional high-resolution X-ray and optical observations may help to further understand the BH natal kicks.
We note that the difference between models is mainly a result of the discrepancies in the system velocities, which is affected by the natal kicks. In models M1−M3 and BAC, it is clear that smaller σkick leads to lower system velocities, for both NS and BH XRBs, as shown in Fig. 5. When σkick is set as constant (models M4−M6 vs. BAC), NS XRBs have the same velocity distributions as expected, and the difference is made solely by BHs. It is obvious that models M4, M6, and BAC (reduced BH kicks) all have similar BH system velocity distributions (hence similar LX vs. R distributions). Their velocities are very low, mainly ~10 km s-1. The moving timescale (from SN to turning on X-rays) is ~1 Myr (Zuo & Li 2014a), and the estimated offset is around 10 pc. So most of these low luminosity BH-MS XRBs cannot move to the outer places to be detected even though in reality they dominate the population (Zuo et al. 2014, see Fig. 1). Instead the NS XRBs appear to dominate. While the system velocities in model M5 (full BH kicks) are higher than those in models M4, M6, and BAC (reduced BH kicks). This pushes more of the BH-MS XRBs farther away from the cluster, overwhelming the NS-XRB population appeared in the region. So the natal kick, by affecting the system velocity of the binary, determines the maximum offset a binary can reach, revealing as distinct LX vs. R distributions. And conversely, more precise measurements of system velocities, as well as LX vs. R distributions may provide interesting clues to understanding the physics of SN natal kicks, and the nature of XRBs observed. This study motivates further efforts to explore the spatial distribution of XRBs, their velocities, as well as source types in nearby star-forming galaxies.
4. Summary
This study shows that, using the apparent LX vs. R distribution, it is possible to investigate the natal kick problem of XRBs, although the results are still subject to some uncertainties and simplified treatments. For example, in the calculation only primordial binaries were evolved; however, in dense star clusters, dynamical interactions, especially dynamical exchanges, may also play an important role in binary formation and kinematics (Mapelli et al. 2013), which is not considered here and is beyond the scope of the paper. Additionally, the orbital velocity of a post common envelope (CE) binary, which is governed by the CE efficiency (αCE), can also affect the system velocity, and hence the spatial offset of the system. Because a reliable value of αCE is somewhat uncertain, I only adopt one typical value here for simplicity (see Zuo & Li 2014b,a, for discussions on αCE). Nevertheless, this study still shows that the LX vs. R distribution is a very powerful way to constrain the dispersion of the kick velocity σkick. The magnitude of σkick is constrained to be larger than ~100 km s-1, while σkick on the order of several tens km s-1 may be excluded, though a low or absent natal kick for ECS NSs is still permitted. In particular, the calculations show that BH natal kicks are not indispensable to account for the LX vs. R distributions. What is more interesting is that full BH natal kicks (i.e., similar to that of NSs may receive) are likely excluded in this study though it has just been suggested recently by Repetto et al. (2012) to explain the observed distribution of LMXBs with BHs. This work justifies further high-resolution optical and X-ray observations of HMXB populations in nearby star-forming galaxies.
To fully explore the parameter space, I also consider full kicks for ECS NSs, and full kicks with a broader fall back mass range, as high as Mfb ~ 1 M⊙, but find no significant difference in the final results.
I also reduced the cluster mass by a factor of 2, and found no significant difference in the final results.
Acknowledgments
I would like to thank Xiang-Dong Li for helpful comments and Bing Jiang for discussions on the Chandra data. This work was supported by the National Natural Science Foundation (grants 11103014 and 11003005), the Research Fund for the Doctoral Program of Higher Education of China (under grant number 20110201120034), the Natural Science Foundation of China (under grant number 10873008), the National Basic Research Program of China (973 Program 2009CB824800), the Fundamental Research Funds for the Central Universities and National High Performance Computing Center (Xi’an).
References
- Arzoumanian, Z., Chernoff, D. F., & Cordes, J. M. 2002, ApJ, 568, 289 [NASA ADS] [CrossRef] [Google Scholar]
- Bailes, M. 1989, ApJ, 342, 917 [NASA ADS] [CrossRef] [Google Scholar]
- Belczynski, K., Dalogera, A., Zezas, A., & Fabbiano, G. 2004, ApJ, 601, L147 [NASA ADS] [CrossRef] [Google Scholar]
- Belczynski, K., Kalogera, V., Rasio, F. A., et al. 2008, ApJS, 174, 223 [NASA ADS] [CrossRef] [Google Scholar]
- Belczynski, K., Bulik, T., Fryer, C., et al. 2010a, ApJ, 714, 1217 [NASA ADS] [CrossRef] [Google Scholar]
- Belczynski, K., Lorimer, D. R., Ridley, J. P., & Curran, S. J. 2010b, MNRAS, 407, 1245 [NASA ADS] [CrossRef] [Google Scholar]
- Blaauw, A. 1961, Bull. Astron. Inst. Netherlands, 15, 265 [NASA ADS] [Google Scholar]
- Bodaghee, A., Tomsick, J. A., Rodriguez, J., & Berian James, J. 2012, 744, 108 [Google Scholar]
- Bondi, H., & Hoyle, F. 1944, MNRAS, 104, 273 [NASA ADS] [CrossRef] [Google Scholar]
- Chen, W., Shrader, C. R., & Livio, M. 1997, ApJ, 491, 312 [NASA ADS] [CrossRef] [Google Scholar]
- Cordes, J. M., & Chernoff, D. F. 1998, ApJ, 505, 315 [NASA ADS] [CrossRef] [Google Scholar]
- Cordes, J. M., Romani, R. W., & Lundgren, S. C. 1993, Nature, 362, 133 [NASA ADS] [CrossRef] [Google Scholar]
- Deway, R. J., & Cordes, J. M. 1987, ApJ, 321, 780 [NASA ADS] [CrossRef] [Google Scholar]
- Dhawan, V., Mirabel, I. F., Ribo, M., & Rodrigues, I. 2007, ApJ, 668, 430 [NASA ADS] [CrossRef] [Google Scholar]
- Dominik, M., Belczynski, K., Fryer, C., et al. 2012, ApJ, 759, 52 [NASA ADS] [CrossRef] [Google Scholar]
- Fasano, G., & Franceschini, A. 1987, MNRAS, 225, 155 [NASA ADS] [CrossRef] [Google Scholar]
- Fragos, T., Willems, B., Kalogera, V., et al. 2009, ApJ, 697, 1057 [NASA ADS] [CrossRef] [Google Scholar]
- Fryer, C., & Kalogera, V. 1997a, ApJ, 489, 244 [NASA ADS] [CrossRef] [Google Scholar]
- Fryer, C., & Kalogera, V. 1997b, erratum: ApJ, 499, 520 [CrossRef] [Google Scholar]
- Fryer, C., Burrows, A., & Benz, W. 1998, ApJ, 498, 333 [NASA ADS] [CrossRef] [Google Scholar]
- Fryer, C. L., Belczynski, K., Wiktorowicz, G., et al. 2012, ApJ, 749, 91 [NASA ADS] [CrossRef] [Google Scholar]
- Garcia, M. R., Miller, J. M., McClintock, J. E., King, A. R., & Orosz, J. 2003, ApJ, 591, 388 [NASA ADS] [CrossRef] [Google Scholar]
- Gualandris, A., Colpi, M., Zwart, S. P., & Possenti, A. 2005, ApJ, 618, 845 [NASA ADS] [CrossRef] [Google Scholar]
- Hansen, B., & Phinney, E. 1997, MNRAS, 291, 569 [NASA ADS] [CrossRef] [Google Scholar]
- Ho, L. C., & Filippenko, A. V. 1996a, ApJ, 466, L83 [NASA ADS] [CrossRef] [Google Scholar]
- Ho, L. C., & Filippenko, A. V. 1996b, ApJ, 472, 600 [NASA ADS] [CrossRef] [Google Scholar]
- Hobbs, G., Lorimer, D. R., Lyne, A. G., & Kramer, M. 2005, MNRAS, 360, 963 [Google Scholar]
- Hurley, J. R., Pols, O. R., & Tout, C. A. 2000, MNRAS, 315, 543 [NASA ADS] [CrossRef] [Google Scholar]
- Hurley, J. R., Tout, C. A., & Pols, O. R. 2002, MNRAS, 329, 897 [NASA ADS] [CrossRef] [Google Scholar]
- Kaaret, P., Alonso-Herrero, A., Gallagher, J. S., et al. 2004, MNRAS, 348, L28 [NASA ADS] [CrossRef] [Google Scholar]
- Lai, D. 2001, in Physics of Neutron Star Interiors, eds. D. Blaschke, N. K. Glendenning, & A. Sedrakian (Berlin: Springer-Verlag), Lect. Notes Phys., 578, 424 [Google Scholar]
- Lai, D., Chernoff, D. F., & Cordes, J. M. 2001, ApJ, 549, 1111 [NASA ADS] [CrossRef] [Google Scholar]
- Lasota, J. P. 2001, New Astron. Rev., 45, 449 [NASA ADS] [CrossRef] [Google Scholar]
- Loveridge, A. J., van der Sluys, M. V., & Kalogera, V. 2011, ApJ, 743, 49 [Google Scholar]
- Lyne, A. G., & Lorimer, D. R. 1994, Nature, 369, 124 [Google Scholar]
- Mapelli, M., Zampieri, L., Ripamonti, E., & Bressan, A. 2013, MNRAS, 429, 2298 [NASA ADS] [CrossRef] [Google Scholar]
- Mineo, S., Gilfanov, M., & Sunyaev, R. 2012, MNRAS, 419, 2095 [NASA ADS] [CrossRef] [Google Scholar]
- Mirabel, I. F., Dhawan, V., Mignani, R. P., Rodrigues, I., & Guglielmetti, F. 2001, Nature, 413, 139 [NASA ADS] [CrossRef] [PubMed] [Google Scholar]
- Nelemans, G., Tauris, T. M., & van den Heuvel, E. P. J. 1999, A&A, 352, L87 [NASA ADS] [Google Scholar]
- Paczyński, B. 1990, ApJ, 348, 485 [NASA ADS] [CrossRef] [Google Scholar]
- Pfahl, E., Rappaport, S., Podsiadlowski, P., & Spruit, H. 2002, ApJ, 574, 364 [NASA ADS] [CrossRef] [Google Scholar]
- Podsiadlowski, P., Langer, N., Poelarends, A. J. T., et al. 2004, ApJ, 612, 1044 [NASA ADS] [CrossRef] [Google Scholar]
- Remillard, R., Morgan, E., Smith, D., & Smith, E. 2000, IAU Circular, 7389, 2 [NASA ADS] [Google Scholar]
- Repetto, S., Davies, M. B., & Sigurdsson, S. 2012, MNRAS, 425, 2799 [NASA ADS] [CrossRef] [Google Scholar]
- van den Heuvel, E. P. J., Portegies Zwart, S. F., Bhattacharya, D., & Kaper, L. 2000, A&A, 364, 563 [NASA ADS] [Google Scholar]
- Vink, J. S., de Koter, A., & Lamers, H. J. G. L. M. 2001, A&A, 369, 574 [NASA ADS] [CrossRef] [EDP Sciences] [Google Scholar]
- Willems, B., Henninger, M., Levin, T., et al. 2005, ApJ, 625, 324 [NASA ADS] [CrossRef] [Google Scholar]
- Wong, T.-W., Willems, B., & Kalogera, V. 2010, ApJ, 721, 1689 [NASA ADS] [CrossRef] [Google Scholar]
- Xu, X. J., & Li, X. D. 2010, ApJ, 716, 114 [NASA ADS] [CrossRef] [Google Scholar]
- Zuo, Z. Y., & Li, X. D. 2010, MNRAS, 405, 2768 [NASA ADS] [Google Scholar]
- Zuo, Z. Y., & Li, X. D. 2014a, MNRAS, 442, 1980 [NASA ADS] [CrossRef] [Google Scholar]
- Zuo, Z. Y., & Li, X. D. 2014b, ApJ, 797, 45 [NASA ADS] [CrossRef] [Google Scholar]
- Zuo, Z. Y., Li, X. D., & Liu, X. W. 2008, MNRAS, 387, 121 [NASA ADS] [CrossRef] [Google Scholar]
- Zuo, Z. Y., Li, X. D., & Gu, Q. S. 2014, MNRAS, 437, 1187 [NASA ADS] [CrossRef] [Google Scholar]
All Tables
All Figures
|
Fig. 1 Normalized cumulative distribution for the numbers of ALL-XRBs (top), NS-XRBs (middle), and BH-XRBs (bottom), respectively. The thick-dotted and dashed lines represent the relative numbers of NS- and BH-XRBs contributing to ALL-XRBs, respectively. The thin-solid, dotted, and dashed lines represent the observed cumulative distributions of source displacements in galaxies M 82, NGC 1569, and NGC 5253 (see Fig. 2 in Kaaret et al. 2004), respectively. From left to right are models M1, M2, BAC, and M3. |
| In the text | |
|
Fig. 2 LX − R distribution for ALL-XRBs (top), NS-XRBs (middle), and BH-XRBs (bottom). Sources from M 82, NGC 1569, and NGC 5253 in Kaaret et al. (2004, see their Fig. 3 samples are also shown as diamonds, triangles and squares, respectively for comparison. From left to right are models M1, M2, BAC, and M3. |
| In the text | |
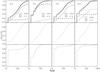 |
Fig. 3 Same as in Fig. 1, but for sources in models M4−M6, and BAC from left to right. |
| In the text | |
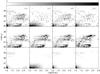 |
Fig. 4 Same as in Fig. 2, but for sources in models M4−M6, and BAC from left to right. |
| In the text | |
|
Fig. 5 Normalized system velocity distributions for BH (solid line) and NS (dotted line) XRBs in models M1−M6, and BAC, respectively. |
| In the text | |
Current usage metrics show cumulative count of Article Views (full-text article views including HTML views, PDF and ePub downloads, according to the available data) and Abstracts Views on Vision4Press platform.
Data correspond to usage on the plateform after 2015. The current usage metrics is available 48-96 hours after online publication and is updated daily on week days.
Initial download of the metrics may take a while.