Fig. 1
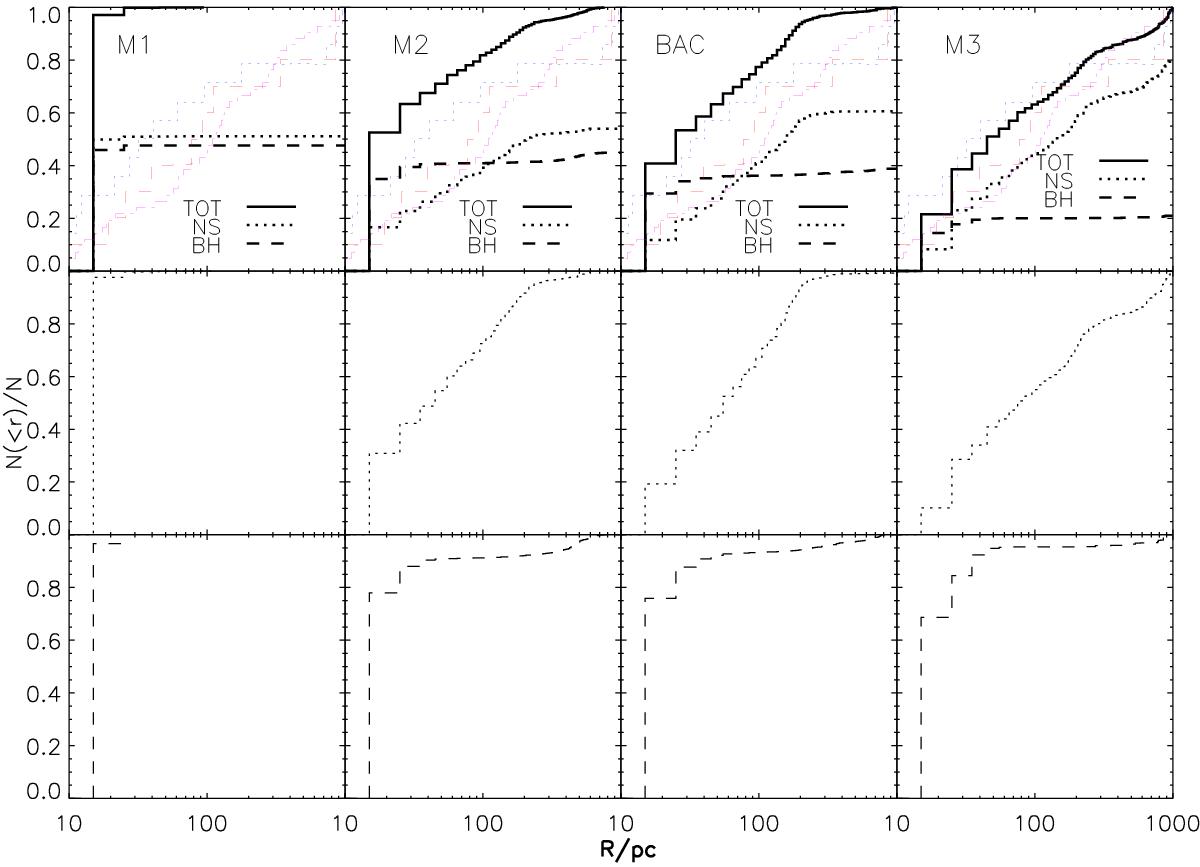
Normalized cumulative distribution for the numbers of ALL-XRBs (top), NS-XRBs (middle), and BH-XRBs (bottom), respectively. The thick-dotted and dashed lines represent the relative numbers of NS- and BH-XRBs contributing to ALL-XRBs, respectively. The thin-solid, dotted, and dashed lines represent the observed cumulative distributions of source displacements in galaxies M 82, NGC 1569, and NGC 5253 (see Fig. 2 in Kaaret et al. 2004), respectively. From left to right are models M1, M2, BAC, and M3.
Current usage metrics show cumulative count of Article Views (full-text article views including HTML views, PDF and ePub downloads, according to the available data) and Abstracts Views on Vision4Press platform.
Data correspond to usage on the plateform after 2015. The current usage metrics is available 48-96 hours after online publication and is updated daily on week days.
Initial download of the metrics may take a while.