Free Access
Fig. 2
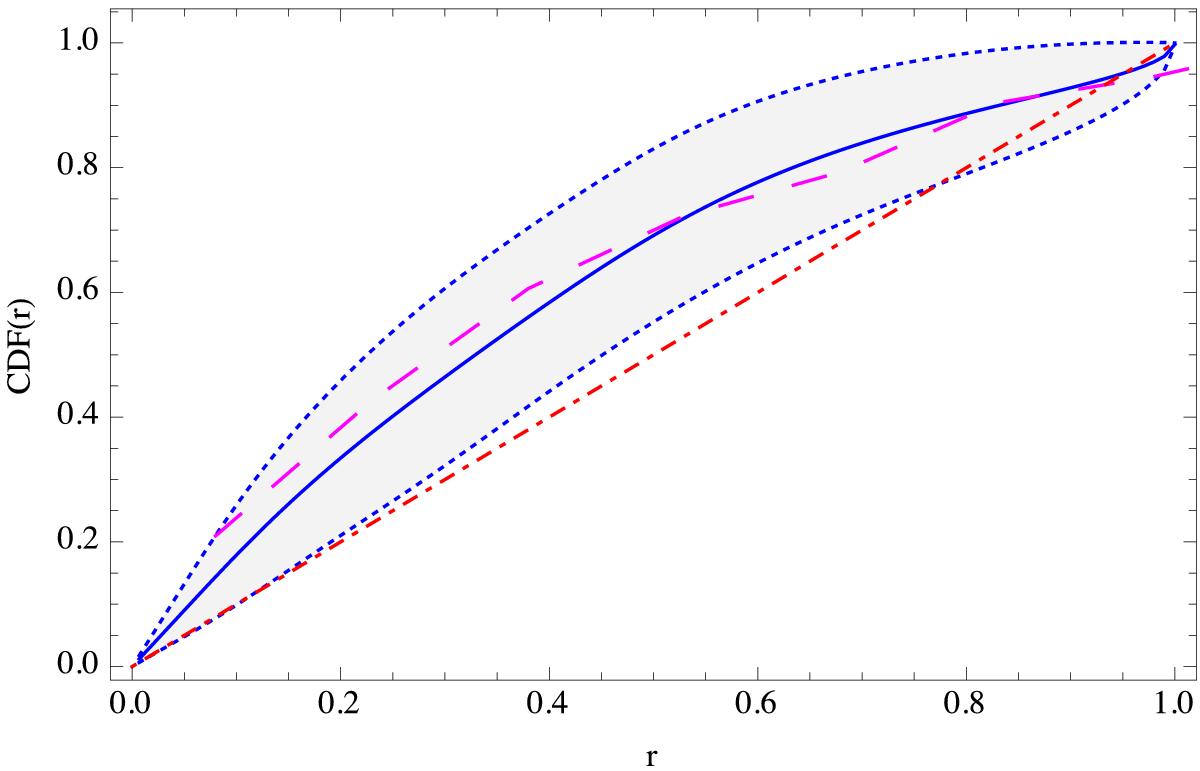
Estimated CDF for the Cyg OB2 association using the sample from Kobulnicky et al. (2014). Our method is plotted as solid lines with the confidence intervals as short-dashed lines. The method of Lucy is plotted as a long-dashed line. The theoretical CDF from a uniform distribution is shown as a dot-dashed line.
Current usage metrics show cumulative count of Article Views (full-text article views including HTML views, PDF and ePub downloads, according to the available data) and Abstracts Views on Vision4Press platform.
Data correspond to usage on the plateform after 2015. The current usage metrics is available 48-96 hours after online publication and is updated daily on week days.
Initial download of the metrics may take a while.