| Issue |
A&A
Volume 573, January 2015
|
|
|---|---|---|
| Article Number | A88 | |
| Number of page(s) | 5 | |
| Section | Cosmology (including clusters of galaxies) | |
| DOI | https://doi.org/10.1051/0004-6361/201424429 | |
| Published online | 23 December 2014 | |
Constraints on the duality relation from ACT cluster data
1
Department of Physics, Imperial CollegeBlackett Laboratory,
London
SW7 2AZ,
UK
e-mail:
This email address is being protected from spambots. You need JavaScript enabled to view it.
2
Departamento de Astronomia, Observatório Nacional,
20921-400
Rio de Janeiro –
RJ,
Brazil
e-mail:
This email address is being protected from spambots. You need JavaScript enabled to view it.
3
Departamento de Física, Universidade Estadual da
Paraíba, 58429-500
Campina Grande –
PB,
Brazil
e-mail:
This email address is being protected from spambots. You need JavaScript enabled to view it.
4
Departamento de Física, Universidade Federal de Campina
Grande, 58429-900
Campina Grande –
PB,
Brazil
e-mail:
This email address is being protected from spambots. You need JavaScript enabled to view it.
Received: 18 June 2014
Accepted: 8 August 2014
Abstract
Aims. The cosmic distance-duality relation, dL(z) /dA(z)(1 + z)2 = η, where dL(z) and dA(z) are, respectively, the luminosity and the angular diameter distances and where η = 1 holds as long as the number of photons is conserved and gravity is described by a metric theory. Testing such hypotheses is, therefore, an important task for both cosmology and fundamental physics.
Methods. We estimated the gas mass fraction of 91 galaxy clusters (GC) from current measurements of the GC total mass recently reported by the Atacama Cosmology Telescope collaboration. We use these data, along with type Ia supernovae observations of the Union 2.1 compilation, to test a possible deviation from the value η = 1.
Results. Although they agree with the standard hypothesis, we find that this combination of both data tends to favor values of η less than 1, which might be associated with some physical processes that increase the number of photons and modifying the above relation to dL< (1 + z)2dA.
Key words: cosmology: theory / galaxies: clusters: general / distance scale
© ESO, 2014
1. Introduction
The so-called distance reciprocity law, which was proven long ago by Etherington (1933; see also Ellis 1971, 2007), is a fundamental keystone for interpreting observational data in cosmology. Considering that the number of photons from a given source is conserved, it provides the following relation between the angular (dA) and luminosity (dL) distances  (1)This version of the reciprocity relation, also known as the cosmic distance-duality relation (CDDR), is valid for all cosmological models based on Riemannian geometry and only requires that source and observer are connected by null geodesics in a Riemannian spacetime and that the number of photons be conserved. Examples of non-standard frameworks that violate the CDDR include scenarios where photons do not travel on unique null geodesics (Csaki et al. 2002), models with variations in fundamental constants (Brax et al. 2013), those with photon non-conservation due to coupling to particles beyond the standard model of particle physics (Avgoustidis et al. 2010, 2012) and with absorption by dust (Basset & Kunz 2004), among others (see Uzan et al. 2004, and references therein).
Recently, several authors have explored different techniques for testing the CDDR. For instance, Bassett & Kunz (2004) used type Ia supernovae (SNe Ia) data, such as measurements of dL and estimates of angular distances from FRIIb radio galaxies (Daly & Djorgovski 2003) and from ultracompact radio sources (Gurvitz 1994, 1999; Lima & Alcaniz 2002), to test possible deviations of the CDDR. Perhaps owing to a lensing magnification bias, they found a 2σ violation caused by an excess in brightening of SNIa at z> 0.5. Ellis et al. (2013) propose an interesting test of Eq. (1) using the cosmic microwave background spectrum. From this observable, it was found that the CDDR relation cannot be violated by more than 0.01% between the decoupling era and today. Khedekar & Chakraborti (2011) propose the use of a redshifted 21 cm signal from disk galaxies, where neutral hydrogen (HI) masses are seen to be almost linearly correlated with surface area, to detect a possible violation of the CDDR. More et al. (2009) discuss the constraints on the CDDR using measurements of baryon acoustic feature and SNe Ia data.
Measurements of the angular diameter distance from galaxy clusters observations, calculated with the X-ray and Sunyaev-Zel’dovich observations, have also been widely used to test the CDDR (see, e.g., Holanda et al. 2012a, and references therein). It is known, however, that the verification of the CDDR validity depends on the assumptions used to describe the galaxy clusters (Holanda et al. 2010, 2012a,b; Nair et al. 2011; Li et al. 2011; Meng et al. 2012; Lima et al. 2012; Xi et al. 2013; Allen et al. 2013). As an example, assuming the CDDR, Holanda et al. (2012b) and Meng et al. (2012) show that the elliptical β-model constitutes a better geometrical description of the galaxy cluster structure when compared to the spherical β-model. Following a different approach, Gonçalves et al. (2012) show that measurements of the gas mass fraction (fgas) of galaxy clusters depend on the validity of the CDDR and used a sample of 38 clusters along with SNe Ia observations to test the CDDR. Assuming a parametrization for a possible deviation from the CDDR, η = 1 + η0z/ (1 + z), they find η0 = −0.07 ± 0.24 at a 95.4% confidence level.
Recently, the cluster’s mass data from 91 galaxy clusters has been detected via the Sunyaev-Zel’dovich effect (SZ; Sunyaev & Zel’dovich 1970) at 148 GHz, as reported by the Atacama Cosmology Telescope (ACT) survey (Hasselfield et al. 2013). It is important to emphasize that the total mass measurements of galaxy clusters depend on the model assumed for the physics of the intracluster gas. The ACT team adopted four models (see Sect. 2.1.1 for details) in order to estimate the corresponding cluster mass M500, defined as the mass measured within the radius R500, at which the enclosed mean density is 500 times the critical density at the cluster redshift. To obtain fgas estimates (one of the main quantities for our analysis) for each cluster in the sample, we use a semi-empirical relation presented by Vikhlinin et al. (2009), where the observed gas fraction, fgas, is a linear function of the logarithm of the cluster total mass, log M, which is fgas = fgas(M). This relation was derived from an observational sample where the total mass and the gas mass of the clusters were obtained by two different approaches. The first one, assuming hydrostatic equilibrium, directly measures the total mass and gas mass from observed ICM parameters (Kravtsov et al. 2006), whereas the second approach consists in measuring the total mass from the average temperature, with the gas mass determined from the X-ray image (Mohr et al. 1999). Although both methods rely on different hypotheses, they show close linear relationships between fgas and log M, as can be inferred from the analyses of Vikhlinin et al. (2009), where the scatter of the data appears consistent with the mass measurement uncertainties of each method. This result validates the use of the fgas = fgas(M) relationship for cluster data, such as the ACT mass estimates, which do not assume hydrostatic equilibrium.
Our goals in this paper are not only to derive new bounds on a possible deviation from Eq. (1) using the current ACT and SNe Ia data, but also to verify the robustness of the methods used to infer M500. In other words, we discuss the compatibility of these methods in light of the CDDR and the assumptions behind it. The paper is organized as follows. In Sect. 2 we describe the observational quantities used in this work. The corresponding constraints on the departures of the CDDR are investigated in Sect. 3. We end this paper by summarizing our main results (Sect. 4).
2. Observational test
We combined two observational data sets to perform our CDDR test: the gas mass fraction (fgas), obtained from the M500 data sets provided by the ACT galaxy clusters survey, and measurements of distance moduli from the Union 2.1 SNe Ia compilation.
2.1. fgas
The so-called gas mass fraction test (Sasaki 1996; Allen et al. 2002, 2008, 2013; Ettori et al. 2009) assumes that the ratio fgas ≡ Mgas/Mtot is fairly constant over their recent cosmic history, where Mgas is the gas mass and Mtot the total mass (including dark matter) of the galaxy cluster.
In recent simulations Battaglia et al. (2014) have shown that astrophysical processes, such as AGN feedback, contribute to driving cluster gas out of cluster potential wells, but this process is most effective early on during the assembly epoch of the cluster, that is, for z> 2. Instead, these simulations (Battaglia et al. 2014) also show that the gas mass fraction reveals no significant evolution in the interval 0 <z ≲ 1. Because the ACT data we are using here have only five galaxy clusters with z> 1 in a sample of 91 (with the highest redshift z = 1.36), and moreover, because the ACT cluster’s masses are within the constraints used in the above simulations, we expect that fgas does not depend noticeably on redshift in the examined data. In this way, we follow similar studies of this subject (see, e.g., Sasaki 1996; Allen et al. 2002, 2008, 2013; Ettori et al. 2009) and assume that fgas is fairly constant in the redshift and total mass data intervals under analysis.
It is well known that the fgas obtained from X-ray measurements is given by (Sasaki 1996)  (2)which is valid only when the CDDR is assumed. The general expression for the gas mass fraction is given by (Gonçalves et al. 2012)
 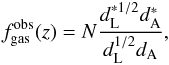 (3)where the symbol ∗ denotes quantities that were obtained for the fiducial model assumed in the observations, and the parameter N defines the astrophysical modeling of the cluster. Many parametrizations are assumed in the literature (Allen et al. 2002, 2008; Ettori et al. 2009, among others), but because we aim to constrain the CDD relation, N is not an important quantity for our analysis, and we marginalize over it. Along with the assumption of the fairly constant Mgas/Mtot ratio mentioned above, the distance ratio of Eq. (3) accounts for deviations in the geometry of the universe from the fiducial model, which makes it possible to use fgas data to test different cosmologies (Lima et al. 2003).
2.1.1. fgas from the ACT catalog
As is widely known, properties of galaxy clusters encode information on the growth of structures in the universe. For this, data from optical and X-ray cluster surveys are currently used to constrain cosmological parameters. Recently, however, a new window of information regarding galaxy cluster physics has opened with the release of cluster surveys (e.g., Staniszewski et al. 2009; Marriage et al. 2011; Williamson et al. 2011; Planck Collaboration VIII 2011; Reichardt et al. 2013) that make use of the SZ effect, which is a signature that does not diminish with luminosity distance because it is nearly independent of redshift. In fact, thermal SZ signal is a tracer of the total thermal energy of the hot (~107 K) intracluster gas, therefore it is correlated to the mass of the cluster.
 |
Fig. 1 Distribution of the number of clusters according to their gas mass fraction fgas. The fgas values were inferred from the M500 data (Hasselfield et al. 2013) according to the four methods discussed in the text. The dashed line, depicted slightly to the right for illustration, is the cosmic mean value for fgas = 0.10 ± 0.02 (David et al. 2012). |
However, a model for the physics of the intracluster gas has to be assumed. Recently, the ACT team has investigated a new approach to obtaining the cluster mass from cluster signals in filtered SZ maps. They first adopt a one-parameter family of universal pressure profiles (UPP) as a baseline model for the intracluster gas pressure profile and apply it to their cluster sample, in order to estimate the corresponding cluster mass (Arnaud et al. 2010). This approach includes a mass dependence in the profile shape, which has been calibrated to X-ray observations using local clusters (z< 0.2). In this way, following this UPP approach, the cluster mass of the sample is measured within a characteristic radius with respect to the critical density such that, for instance, M500 is defined as the mass measured within the radius, R500, at which the enclosed mean density is 500 times the critical density at the cluster redshift. In this case, the cluster’s mass obtained using this method are termed  .
.
As mentioned earlier, it is possible to obtain fgas from the total mass by using the semi-empirical relation discussed by Vikhlinin et al. (2009). Such a relation can be written as 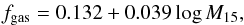 (4)where M15 is the cluster total mass M500 in units of 1015h-1M⊙. It is worth mentioning that this relation does not assume the validity of the CDDR in their derivation.
Besides this UPP model procedure, three other approaches have been adopted by the ACT team to study the scaling relations that allow us to estimate M500 from the cluster SZ signal strength. These are based on (i) structure formation simulations (Bode et al. 2012), where the density and temperature of the intracluster are modeled as a virialized ideal gas ( ); (ii) a non-thermal pressure and adiabatic model for the gas (
 ; Trac et al. 2011); and (iii) a dynamical estimate of the cluster mass using the galaxy velocity dispersions (
 ; Sifon et al. 2013). It is worth mentioning that, when assuming the so-called concordance cosmology (a flat ΛCDM model with Ωm = 0.3), the scaling from UPP is nearly identical to the adiabatic non-thermal model, while a model incorporating non-thermal pressure is in better agreement with dynamical mass measurements (Hasselfield et al. 2013). Considering these four methods for estimating M500, in Fig. 1 we show the distribution of the number of clusters according to their gas mass fraction inferred from the ACT sample.
The linear relationship between fgas and log M in Eq. (4) was derived using low-redshift (i.e., z< 0.3) X-ray data. It is natural to expect that, owing to galaxy cluster’s evolution, such linear dependence would change for high redshifts. However, Vikhlinin et al. (2009) performed simulations and found that, although the redshift-dependence exists, it is almost completely removed, thereby escalating the cluster’s masses again by the characteristic non-linear mass scale Mnl, which corresponds to a linear fluctuation amplitude of 1.686: σ(Mnl) = 1.686. In other words, these simulations indicate that fgas(M/Mnl) is almost redshift-independent, at least at z ~ 1 (see Vikhlinin et al. 2009, Sect. 4.2.2). We performed analyses that re-escalate the galaxy cluster’s masses and found that the largest discrepancy in the χ2 value is less than 2.7% (UPP model).
2.2. SNe Ia
To obtain measurements of dL, we use the distance moduli (μ) obtained from current SNe Ia observations. This quantity is related to the luminosity distance by 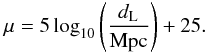 (5)The data set used for SNe Ia is the Union 2.1 compilation (Suzuki et al. 2011), which contains 580 events distributed in the redshift range 0.01 <z< 1.41. The SNe Ia redshifts were carefully chosen to coincide with the ones of the associated galaxy cluster sample with Δz ≡ | zcluster − zSNe Ia | ≤ 0.01 (Fig. 2). For more details on SNe Ia analysis, we refer the reader to Suzuki et al. (2011).
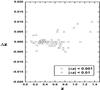 |
Fig. 2 Redshift difference between SNe Ia and galaxy clusters used in the analysis. |
3. Analysis and results
To analyze the validity of the CDDR, we rewrite Eq. (1) as dL/dA(1 + z)2 = η(z), where η(z) quantifies a possible deviation from the CDDR. In our analysis we assume η(z) = 1 + η0z, which is compatible with the cosmographic limit η(z ≪ 1) = 1. Combining the above equation with Eqs. (3) and (5), we obtain (Gonçalves et al. 2012) 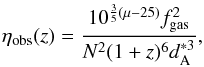 (6)which is the observed quantity built from measurements of μ and fgas. Thus, the likelihood estimator is determined by a χ2 statistic
 ![Mathematical equation: \hbox{$\chi^{2} = \sum_{i}\left[\eta(z_i) - \eta_{\rm obs}(z_i) \right]^{2}/{\sigma^2_{\eta_{\rm obs}}}$}](/articles/aa/full_html/2015/01/aa24429-14/aa24429-14-eq64.png) , where
, where  takes the propagation of the statistical errors into account in Eq. (4). As mentioned earlier, the normalization factor N (see Eq. (2)) is taken as a nuisance parameter so that we marginalize over it.
Bounds on η0 from fgas obtained using four different methods, as explained in the text.
The first results of this analysis are presented in Table 1. All methods considered are compatible with the CDDR at the 2σ level. For comparison, we also show the result of the reduced χ2 (χ2/ν, where ν are the degrees of freedom) and of the p-value. The latter quantity refers to the probability of obtaining a test at least as extreme as the observed one, under the assumption that the null hypothesis, i.e. η0 = 0, is true. For instance, p< 0.05 indicates that the null hypothesis is probably false (Jeffreys 1961; Robert et al. 2009). Clearly, this is not the case for the results presented above because, for the four M500-methods considered here, we find p-values that are higher than 0.7.
In the analysis above, the maximum difference between the redshifts of the clusters and the SNIa is Δz ≤ 0.01. We also performed the same analysis, restricting our data set to a subset where Δz ≤ 0.001. This is an important aspect for analyses of the CDDR involving different types of observables since the reciprocity theorem is valid for sources at the very same redshift. The number of points in this new subset decreases to 55 points, whereas the χ2 improves about 15%. The mean values remain much the same, but the validity of CDDR can be verified even when considering 1σ error, as we can see in Table 2.
An important aspect worth mentioning is that the likelihoods for η0 (regardless of the method considered) have values that are preferably negative, indicating that  may be underestimated and favoring a reduction of dL relative to dA (see Eq. (1)). This is in full agreement with the results obtained by Holanda et al. (2012a), who only use measurements of fgas from the SZ and X-ray observations. Physically, such a result can be explained by a radiative process that increases the number of photons in a light bundle and therefore increases the apparent luminosity, making the source appear closer. (We refer the reader to Avgoustidis 2010, 2012 for more on possible coupling of exotic particles with photons.) Another explanation would be a possible excess of brightness of the SNe Ia data or a value unsuitable for the galaxy cluster borders (R500), which may underestimate the gas mass fraction calculated in Eq. (4).
Same as in Table 1 considering Δz ≤ 0.001.
4. Conclusions
In this paper, we have investigated whether the four physical models used by the ACT to describe the intracluster gas of 91 galaxy clusters are compatible with the validity of the CDDR, dL/dA(1 + z)2 = 1. For this purpose, we alleviated the equality to dL/dA(1 + z)2 = η, where η is a time-dependent parametrization. In our analysis, we adopted a linear parametrization written as η(z) = 1 + η0z for which values apart from η0 = 0 leads to a violation of CDDR. To obtain the observational values for dL, we used 580 measurements of distance moduli from SNe Ia (from Union 2.1, see Suzuki et al. 2012). For dA, we first used a result of Vikhlinin et al. (2009) to obtain 91 gas mass fraction data from the galaxy cluster’s total mass measurements (from the ACT survey, see Marriage et al. 2011; Hasselfield et al. 2013) and then followed Gonçalves et al. (2012) to derive the dA data points.
This statistical analyses showed that the results are almost independent of the method used to obtain Mgas. The main result of this analysis was performed by restricting the difference between zcluster and zSNe Ia to Δz ≤ 0.001. In this case, the validity of the CDDR can be probed within a 1σ level irrespective of the M500 method adopted. These results reinforce the interest in probing the CDDR using new and more precise techniques, since a clear departure from η0 = 0 may be associated either with an exotic gravity theory or with non-conservation of the photon number during the cosmic history.
Acknowledgments
The authors thank CNPq, INCT-A, INEspaço, and FAPERJ for the grants under which this work was carried out.
References
- Allen, S. W., Schmidt, R. W., & Fabian, A. C. 2002, MNRAS, 334, L1 [Google Scholar]
- Allen, S. W., Schmidt, R. W., Fabian, A. C., et al. 2004, MNRAS, 353, 457 [NASA ADS] [CrossRef] [Google Scholar]
- Allen, S. W., Rapetti, D. A., Schmidt, R. W., et al. 2008, MNRAS, 383, 879 [NASA ADS] [CrossRef] [Google Scholar]
- Allen, S. W., Mantz, A. B., Morris, R. G., et al. 2013 [arXiv:1307.8152] [Google Scholar]
- Arnaud, M., Pratt, G. W., Piffaretti, R., et al. 2010, A&A, 517, A92 [NASA ADS] [CrossRef] [EDP Sciences] [Google Scholar]
- Avgoustidis, A., Burrage, C., Redondo, J., Verde, L., & Jimenez, R. 2010, J. Cosmol. Astropart. Phys., 10, 024 [Google Scholar]
- Avgoustidis, A., Luzzi, G., Martins, C. J. A. P., & Monteiro, A. M. R. V. L. 2012, J. Cosmol. Astropart. Phys., 2, 013 [Google Scholar]
- Basset, B. A., & Kunz, M. 2004, Phys. Rev. D, 69, 305 [Google Scholar]
- Battaglia, N., Bond, J. R., Pfrommer, C., & Sievers, J. L. 2013, ApJ, 777, 2 [Google Scholar]
- Bode, P., Ostriker, J. P., Cen, R., & Trac, H. 2012, ApJ, submitted [arXiv:1204.1762] [Google Scholar]
- Brax, P., Burrage, C., Davis, A.-C., & Gubitosi, G. 2013, J. Cosmol. Astropart. Phys., 11, 001 [Google Scholar]
- Csaki, C., Kaloper, N., & Terning, J. 2002, Phys. Rev. Lett., 88, 1302 [Google Scholar]
- Daly, R. A., & Djorgovski, S. G. 2003, ApJ, 597, 9 [NASA ADS] [CrossRef] [Google Scholar]
- David, L. P., Jones, C., & Forman, W. 2012, ApJ, 748, 120 [NASA ADS] [CrossRef] [Google Scholar]
- Ellis, G. F. R. 1971, Relativistic Cosmology, Proc. Int. School Phys. Enrico Fermi, ed. R. K. Sachs (New York: Academic Press), 104; reprinted in Gen. Rel. Grav., 41, 581, 2009 [Google Scholar]
- Ellis, G. F. R. 2007, Gen. Rel. Grav., 39, 1047 [NASA ADS] [CrossRef] [Google Scholar]
- Ellis, G. F. R., Poltis, R., Uzan, J.-P., & Weltman, A. 2013, Phys. Rev. D, 87, 530 [Google Scholar]
- Etherington, I. M. H. 1933, Phil. Mag., 15, 761, reprinted in Gen. Rel. Grav., 39, 1055, 2007 [Google Scholar]
- Ettori, S., Morandi, A., Tozzi, P., et al. 2009, A&A, 501, 61 [NASA ADS] [CrossRef] [EDP Sciences] [Google Scholar]
- Gurvitz, L. I. 1994, ApJ, 425, 442 [NASA ADS] [CrossRef] [Google Scholar]
- Gurvitz, L. I., Kellermann, K. I., & Frey, S. 1999, A&A, 342, 378 [NASA ADS] [Google Scholar]
- Gonçalves, R. S., Holanda, R. F. L., & Alcaniz, J. S. 2012, MNRAS, 420, L43 [NASA ADS] [Google Scholar]
- Hasselfield, M., Hilton, M., Marriage, T. A., et al. 2013, J. Cosmol. Astropart. Phys., 07, 008 [NASA ADS] [CrossRef] [Google Scholar]
- Holanda, R. F. L., Lima, J. A. S., & Ribeiro, M. B. 2010, ApJ, 722, L233 [NASA ADS] [CrossRef] [Google Scholar]
- Holanda, R. F. L., Gonçalves, R. S., & Alcaniz, J. S. 2012a, J. Cosmol. Astropart. Phys., 06, 022 [Google Scholar]
- Holanda, R. F. L., Lima, J. A. S., & Ribeiro, M. B. 2012b, A&A, 538, A131 [NASA ADS] [CrossRef] [EDP Sciences] [Google Scholar]
- Jeffreys, H. 1961, Theory of probability, 3rd edn., (reprinted 1998) (Oxford, UK: Oxford University Press) [Google Scholar]
- Khedekar, S., & Chakraborti, S. 2011, Phys. Rev. Lett., 106, 22 [CrossRef] [Google Scholar]
- Kravtsov, A. V., Vikhlinin, A., & Nagai, D. 2006, ApJ, 650, 128 [NASA ADS] [CrossRef] [Google Scholar]
- Li, Z., Wu, P., & Yu, H. 2011, ApJ, 729, L14 [NASA ADS] [CrossRef] [Google Scholar]
- Lima, J. A. S., & Alcaniz, J. S. 2002, ApJ, 566, 15 [NASA ADS] [CrossRef] [Google Scholar]
- Lima, J. A. S., Cunha, J. V., & Alcaniz, J. S. 2003, Phys. Rev. D, 68, 510 [Google Scholar]
- Lima, J. A. S., Cunha, J. V., & Zanchin, V. T. 2012, ApJ, 742, L26 [NASA ADS] [CrossRef] [Google Scholar]
- Marriage, T. A., Acquaviva, V., Ade, P. A. R., et al. 2011, ApJ, 737, 61 [NASA ADS] [CrossRef] [Google Scholar]
- Meng, X.-L., Zhang, T.-J., & Zhan, H. 2012, ApJ, 745, 98 [NASA ADS] [CrossRef] [Google Scholar]
- Mohr, J. J., Mathiesen, B., & Evrard, A. E. 1999, ApJ, 517, 627 [NASA ADS] [CrossRef] [Google Scholar]
- More, S., Bovy, J., & Hogg, D. W. 2009, ApJ, 696, 2 [Google Scholar]
- Nair, R., Jhingan, S., & Jain, D. 2011, JCAP, 05, 023 [NASA ADS] [Google Scholar]
- Planck Collaboration VIII. 2011, A&A, 536, A8 [NASA ADS] [CrossRef] [EDP Sciences] [Google Scholar]
- Reichardt, C. L., Stalder, B., Bleem, L. E., et al. 2013, ApJ, 763, 127 [NASA ADS] [CrossRef] [Google Scholar]
- Robert, C. P., Chopin, N., & Rosseau, J. 2009, Statistical Science, 24, 141 [Google Scholar]
- Sarazin, C. L. 1988, X-ray Emission from Cluster of Galaxies (Cambridge: Cambridge Univ. Press) [Google Scholar]
- Sasaki, S. 1996, PASJ, 48, L119 [NASA ADS] [CrossRef] [Google Scholar]
- Sifón, C., Menanteau, F., Hasselfield, M., et al. 2013, ApJ, 772, 25 [NASA ADS] [CrossRef] [Google Scholar]
- Staniszewski, Z., Ade, P. A. R., Aird, K. A., et al. 2009, ApJ, 701, 32 [CrossRef] [Google Scholar]
- Sunyaev, R. A., & Zel’dovich, Y. B. 1970, Comm. Astrophys. Space Phys., 2, 66 [Google Scholar]
- Suzuki, N., Rubin, D., Lidman, C., et al. 2012, ApJ, 746, 85 [NASA ADS] [CrossRef] [Google Scholar]
- Trac, H., Bode, P., & Ostriker, J. P. 2011, ApJ, 727, 94 [NASA ADS] [CrossRef] [Google Scholar]
- Uzan, J. P., Aghanim, N., & Mellier, Y. 2004, Phys. Rev. D, 70, 083533 [NASA ADS] [CrossRef] [Google Scholar]
- Vikhlinin, A., Kravtsov, A., Forman, W., et al. 2006, ApJ, 640, 691 [NASA ADS] [CrossRef] [Google Scholar]
- Vikhlinin, A., Kravtsov, A. V., Burenin, R. A., et al. 2009, ApJ, 692, 1060 [NASA ADS] [CrossRef] [Google Scholar]
- Williamson, R., Benson, B. A., High, F. W., et al. 2011, ApJ, 738, 139 [NASA ADS] [CrossRef] [Google Scholar]
- Xi, Y., Hao-Ran, Y., Zhi-Song, Z., & Tong-Jie, Z. 2013, ApJ, 777, L24 [NASA ADS] [CrossRef] [Google Scholar]
All Tables
Bounds on η0 from fgas obtained using four different methods, as explained in the text.
All Figures
|
Fig. 1 Distribution of the number of clusters according to their gas mass fraction fgas. The fgas values were inferred from the M500 data (Hasselfield et al. 2013) according to the four methods discussed in the text. The dashed line, depicted slightly to the right for illustration, is the cosmic mean value for fgas = 0.10 ± 0.02 (David et al. 2012). |
| In the text | |
|
Fig. 2 Redshift difference between SNe Ia and galaxy clusters used in the analysis. |
| In the text | |
Current usage metrics show cumulative count of Article Views (full-text article views including HTML views, PDF and ePub downloads, according to the available data) and Abstracts Views on Vision4Press platform.
Data correspond to usage on the plateform after 2015. The current usage metrics is available 48-96 hours after online publication and is updated daily on week days.
Initial download of the metrics may take a while.