Fig. 5
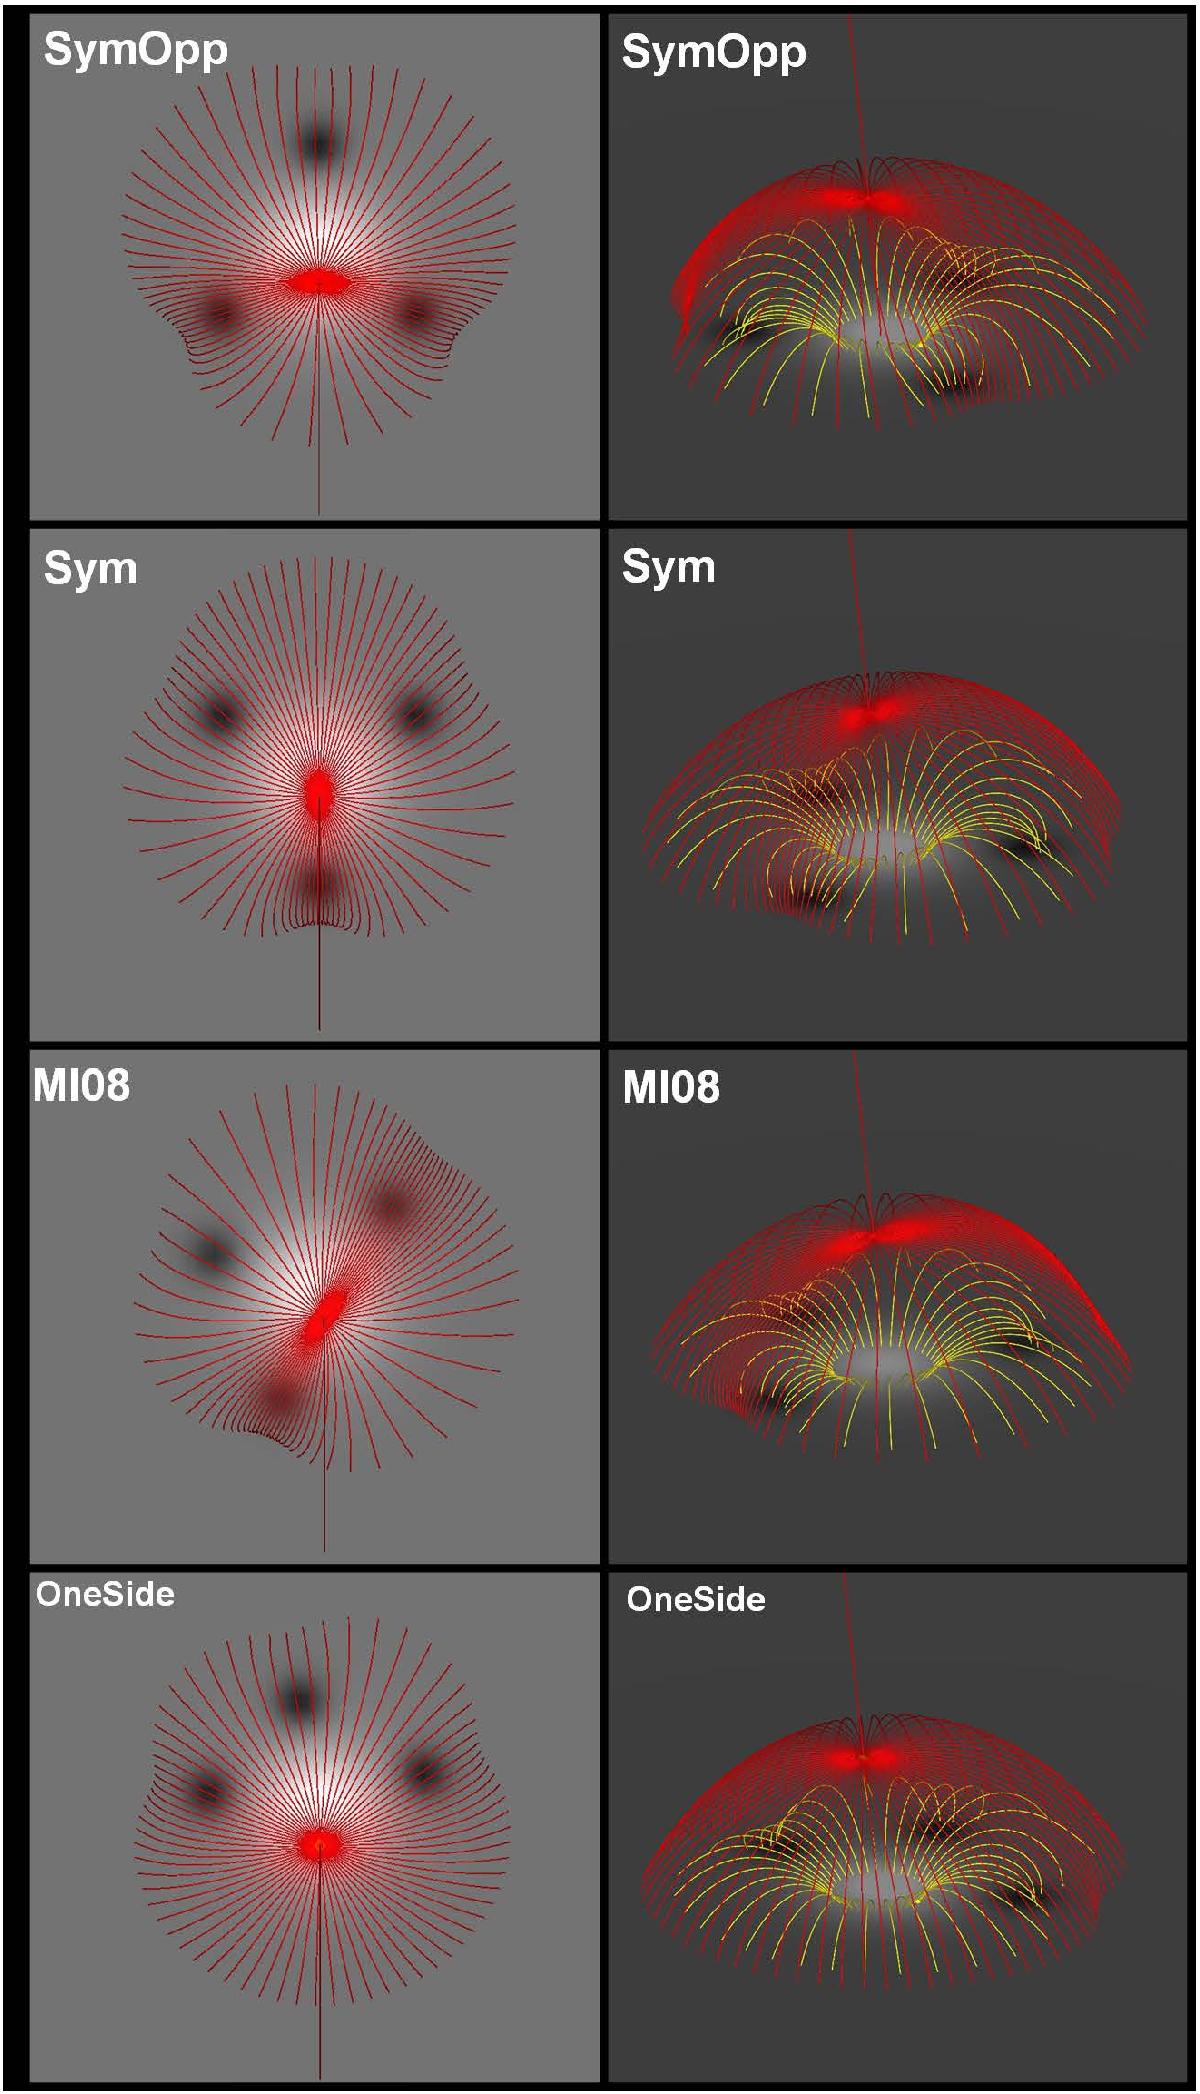
Left panels: top views of the bottom boundary distribution of the vertical magnetic-field component (Bz) coded in levels of gray for the different runs. The red field lines map the initial (t = 0) separatrices passing by the 3D null point, bounding the open and closed magnetic connectivity domains. Right panels: side views of the initial potential magnetic configuration (t = 0) for the different simulations. The red field lines are those shown in the left panels. The yellow field lines outline the connectivity in the closed domain and are plotted from footpoints distributed along a circle on the bottom boundary of radius r = 0.6 centered on the footpoint of the inner spine.
Current usage metrics show cumulative count of Article Views (full-text article views including HTML views, PDF and ePub downloads, according to the available data) and Abstracts Views on Vision4Press platform.
Data correspond to usage on the plateform after 2015. The current usage metrics is available 48-96 hours after online publication and is updated daily on week days.
Initial download of the metrics may take a while.