Fig. 2
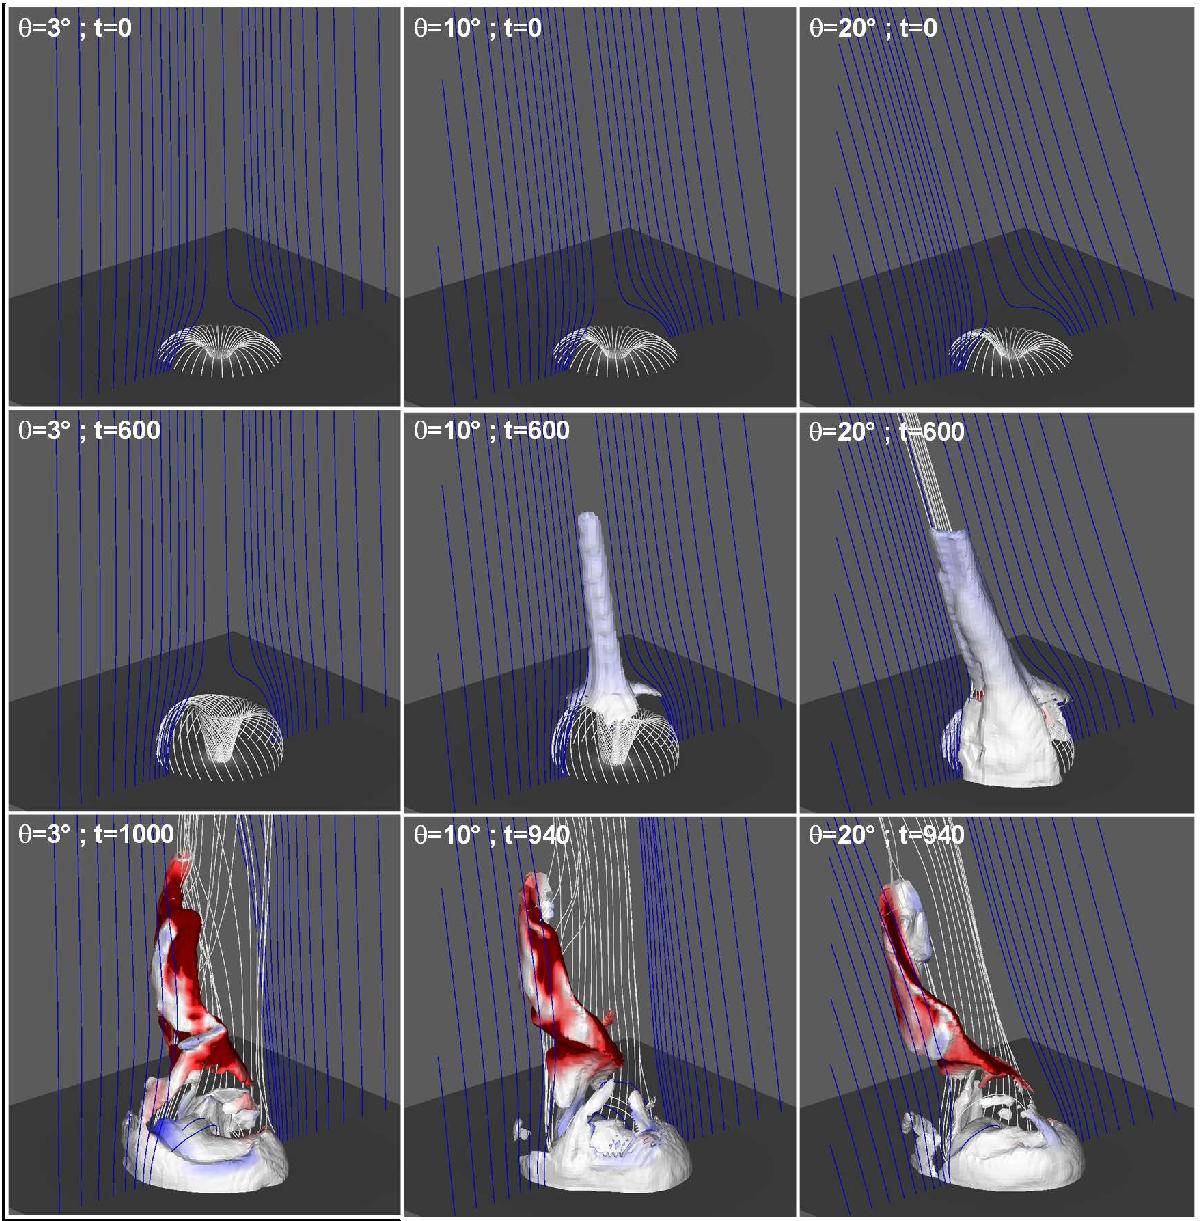
Evolution of the system for θ = 3° (left column), 10° (central column), and 20° (right column). The bottom boundary displays the distribution of Bz. The top row shows the initial configuration. The blue field lines are plotted at fixed intervals along x = 0 and z = 0 from fixed footpoints in the initially open domain. The white field lines are plotted from fixed footpoints along a circle of radius r = 3 and are initially closed. The middle row displays the system at t = 600 during the straight jet phase. Isosurfaces of the plasma density at ρ/ρ0 = 1.05 are color shaded according to the vertical velocity vz, showing the acceleration of plasma in the straight jet. The bottom row presents the system during the helical jet phase. Isosurfaces of the plasma density at ρ/ρ0 = 1.2 are color shaded according to vx: red and blue indicate plasma flow away from and toward the observer (similar to Dopplergrams), highlighting the strong rotation in the helical jet.
Current usage metrics show cumulative count of Article Views (full-text article views including HTML views, PDF and ePub downloads, according to the available data) and Abstracts Views on Vision4Press platform.
Data correspond to usage on the plateform after 2015. The current usage metrics is available 48-96 hours after online publication and is updated daily on week days.
Initial download of the metrics may take a while.