Fig. 1
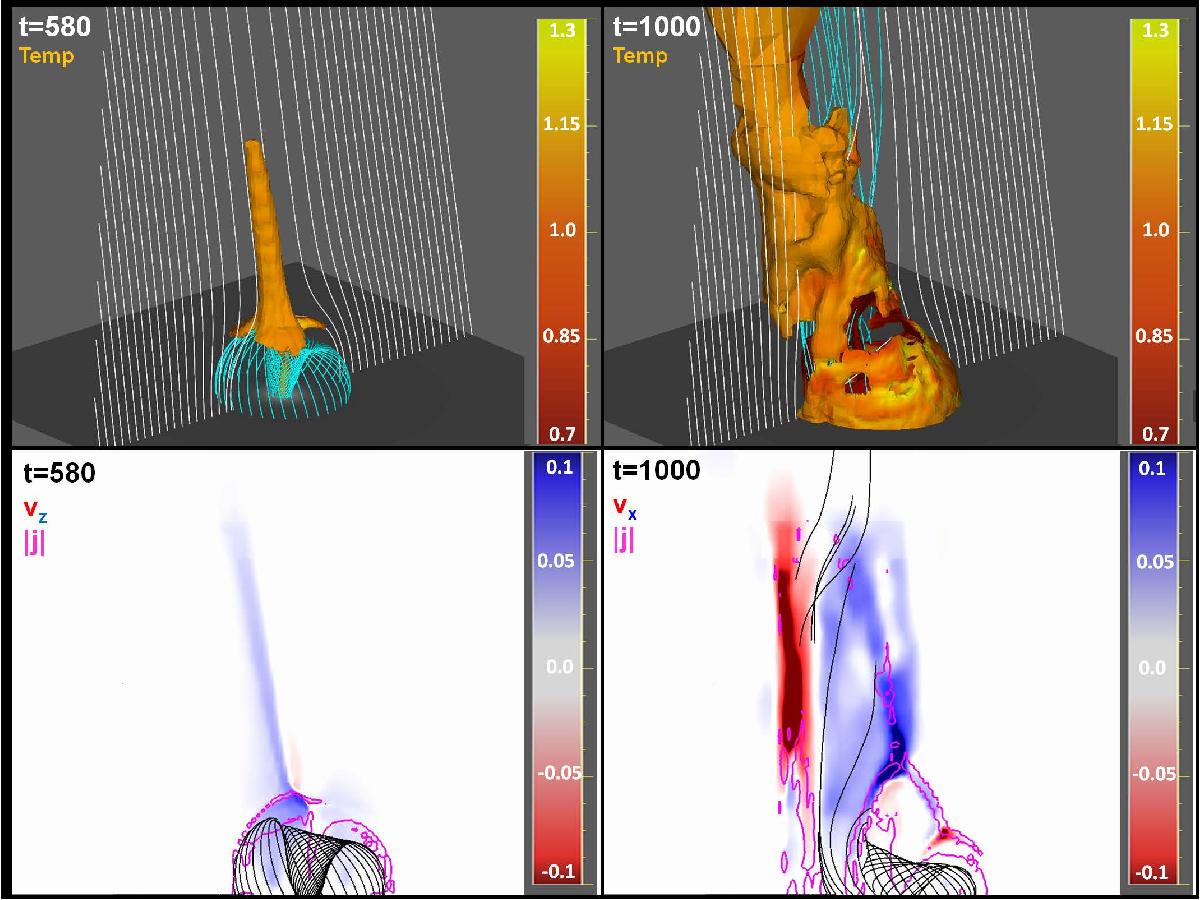
Morphology of the straight jet (left panels, t = 580 nondimensional units) and the helical jet (right panels, t = 1000) in the θ = 10° run presented in Sect. 3. Top panels: isosurfaces of plasma density at ρ/ρ0 = 1.05 color-coded according to plasma temperature. The white field lines are plotted regularly along x = 0 and z = 0 from fixed footpoints in the initially open connectivity domain. The cyan field lines are plotted from fixed footpoints along a circle of radius r = 3 and are initially closed. Bottom left panel: 2D distribution of the z component of the velocity field in the x = 0 plane. Blue and red indicate upward and downward flows. Bottom right panel: 2D distribution of the x component of the velocity field in the x = 0 plane. Blue and red indicate flows toward and away from the observer. The black field lines are all initially closed and correspond to the cyan field lines of the upper panel. The magenta lines are isocontours of the electric current density magnitude in the plane.
Current usage metrics show cumulative count of Article Views (full-text article views including HTML views, PDF and ePub downloads, according to the available data) and Abstracts Views on Vision4Press platform.
Data correspond to usage on the plateform after 2015. The current usage metrics is available 48-96 hours after online publication and is updated daily on week days.
Initial download of the metrics may take a while.