Fig. 4
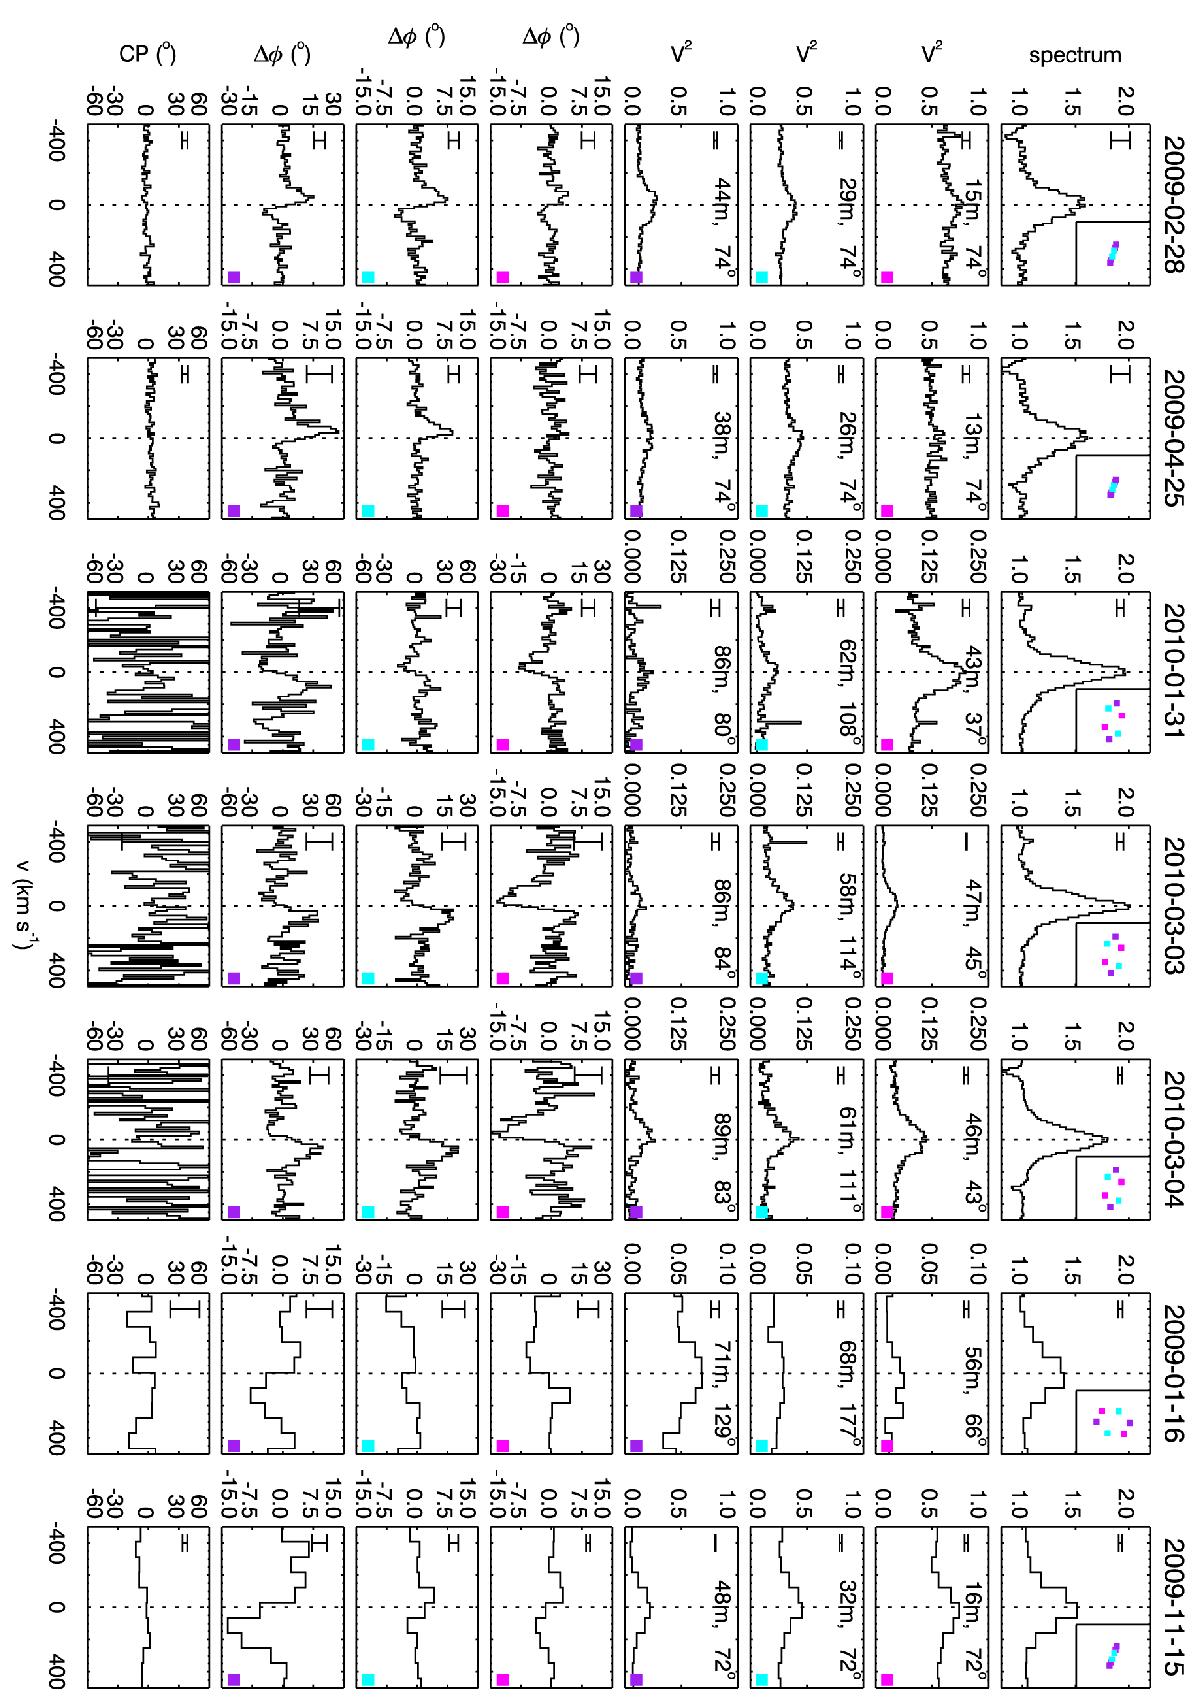
Spectra, squared visibilities, differential phases and closure phase of the Brγ line observed by AMBER. The top and bottom panels display the high- and medium-resolution data, respectively. Error bars are calculated as the 1σ noise level in the continuum. The array configurations, baseline lengths and position angles (N through E) are displayed in the top right corners of the panels. Colored squares in the bottom right corners connect properties of identical baselines.
Current usage metrics show cumulative count of Article Views (full-text article views including HTML views, PDF and ePub downloads, according to the available data) and Abstracts Views on Vision4Press platform.
Data correspond to usage on the plateform after 2015. The current usage metrics is available 48-96 hours after online publication and is updated daily on week days.
Initial download of the metrics may take a while.