Fig. 7
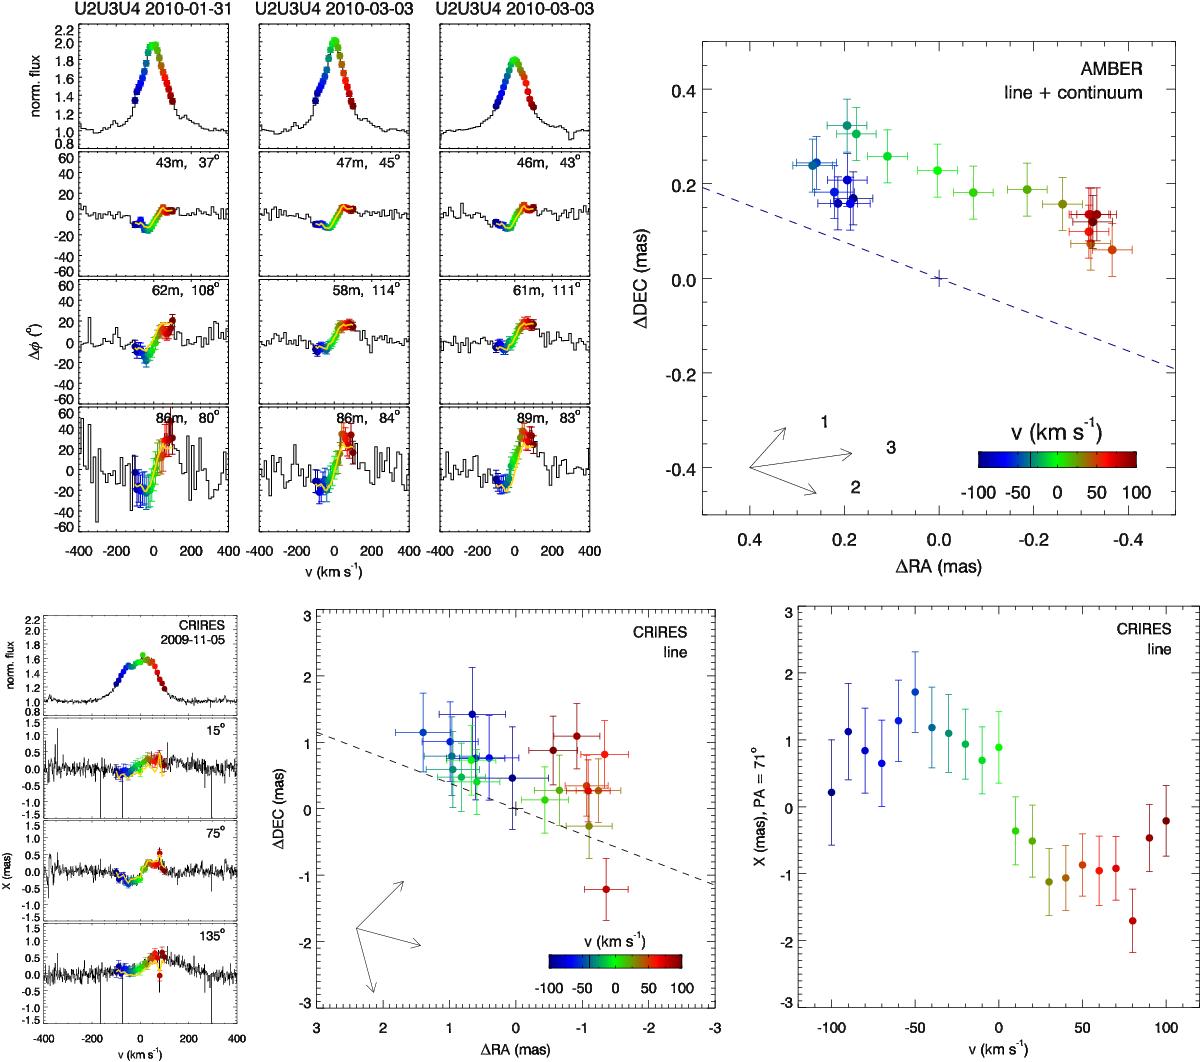
Top left: Brγ spectrum and differential phase measured over the three U2U3U4 baselines in three different observations with AMBER. Overplotted are the data rebinned on Δν = 20 km s-1 from –210 to 210 km s-1, color-coded with their velocity. The yellow lines correspond to the astrometric solution, P(λ), converted back to Δφ. Top right: two-dimensional representation of the photocenter displacement, P(λ), as a function of velocity across the Brγ line. North is up, east to the left. The (averaged) baselines of the U2U3U4 triplet are indicated in the bottom left. The dashed line corresponds to the orientation of the disk major axis (ψ = 71°) as derived by BF11. Bottom left: spectrum and spectro-astrometric signal detected by CRIRES; same colors as above. Bottom middle: photocenter displacement for CRIRES observations, continuum-corrected. Bottom right: photocenter displacement for CRIRES observations along the disk major axis (ψ = 71°).


Current usage metrics show cumulative count of Article Views (full-text article views including HTML views, PDF and ePub downloads, according to the available data) and Abstracts Views on Vision4Press platform.
Data correspond to usage on the plateform after 2015. The current usage metrics is available 48-96 hours after online publication and is updated daily on week days.
Initial download of the metrics may take a while.